
Schedule delays
Shutdown Schedule Delays: Causes, Indicators and Recovery
Shutdown schedules slip for a short list of reasons: scope added after the freeze, double-booked crews, late materials, permit and isolation waits, logic and float errors, and unreliable progress data. Each has an early indicator and a standard response, and only a delay beyond a job's float moves the finish date.
There is no published data on how much shutdowns overrun, so this page gives causes and methods, not percentages.
How MaintWiz helps: Delays are cheaper to fix when you see them on the critical path early. The MaintWiz shutdown module puts the whole shutdown on a Gantt chart with the critical path, float and baselines, so you can see what moves the finish date. See the module · Get the Gantt template
By Jai Balachandran · Published · Last reviewed
What MaintWiz adds:Gantt with critical path and floatBaselines show what movedFloat flag at your limitOne plan from portfolio to task
Causes
What causes shutdown schedule delays?
Shutdown schedules slip mainly because of scope added late, resource conflicts, late materials, permit and isolation waits, logic and float errors, unreliable progress data and shift handover failures, each of which has a leading indicator and a standard response. 1,2,4
Late parts are a leading cause; see shutdown spare parts planning. On cost overruns, see why shutdowns go over budget. For SAP requisitions and late parts see SAP MM shutdown materials.
| Cause | How it shows up | Leading indicator | Prevention | Recovery | Basis |
|---|---|---|---|---|---|
| Scope added after the freeze | Work list grows; critical-path jobs extend | Scope growth, open change requests | Freeze the scope; plan contingency; decision rule for late work | Defer what can wait; approve only with a stated schedule effect | NERC treats discovery work as outside the original scope NERC GADS |
| Crews or equipment double-booked | A job waits for a crew that is still on another job | Resource peaks above availability | Resource-load the schedule and level it | Add shifts or crews on critical jobs only | GAO resource-loaded schedule GAO schedule guide; HSE competing demands HSE HSG253 |
| Materials not at the work face | Jobs start late or stop for parts | Kits complete versus jobs due | Order long-lead items first; kit before the stop | Expedite for critical jobs; re-sequence others | Working analysis |
| Permit and isolation waits | Crews standing by for a permit or an isolation | Permits waiting; issuer queue | Roster issuers for peak days; limit active permits | Add issuer resource; clear the oldest waits first | HSE on permit supervision at shutdown peaks HSE HSG250 |
| Logic and float errors | Float used up unnoticed; date constraints hide the real critical path | Float consumed on near-critical jobs | Review the logic; treat float as shared, not contingency | Recalculate daily; escalate near-critical jobs | GAO on float and constraints GAO schedule guide |
| Unreliable progress data | Percent complete looks fine until the last day | Disagreement between reported and observed progress | Measure completed steps against actual dates | Re-measure the critical-path jobs on site | GAO: percent complete is subjective GAO schedule guide |
| Shift handover failures | Work repeated or restarted after a shift change | Handover log gaps | Face-to-face, two-way handover with a log | Restate status at the next meeting | HSE on shift handover HSE shift handover |
The order is a working view, not a ranked statistic; there is no published data on cause frequency. Rows without a public source are labeled working analysis.
Calculator
When does a late job actually delay the finish?
A late job delays the finish only by the amount its slip exceeds its total float; GAO defines total float as the time an activity can slip before its delay affects the end date. 1
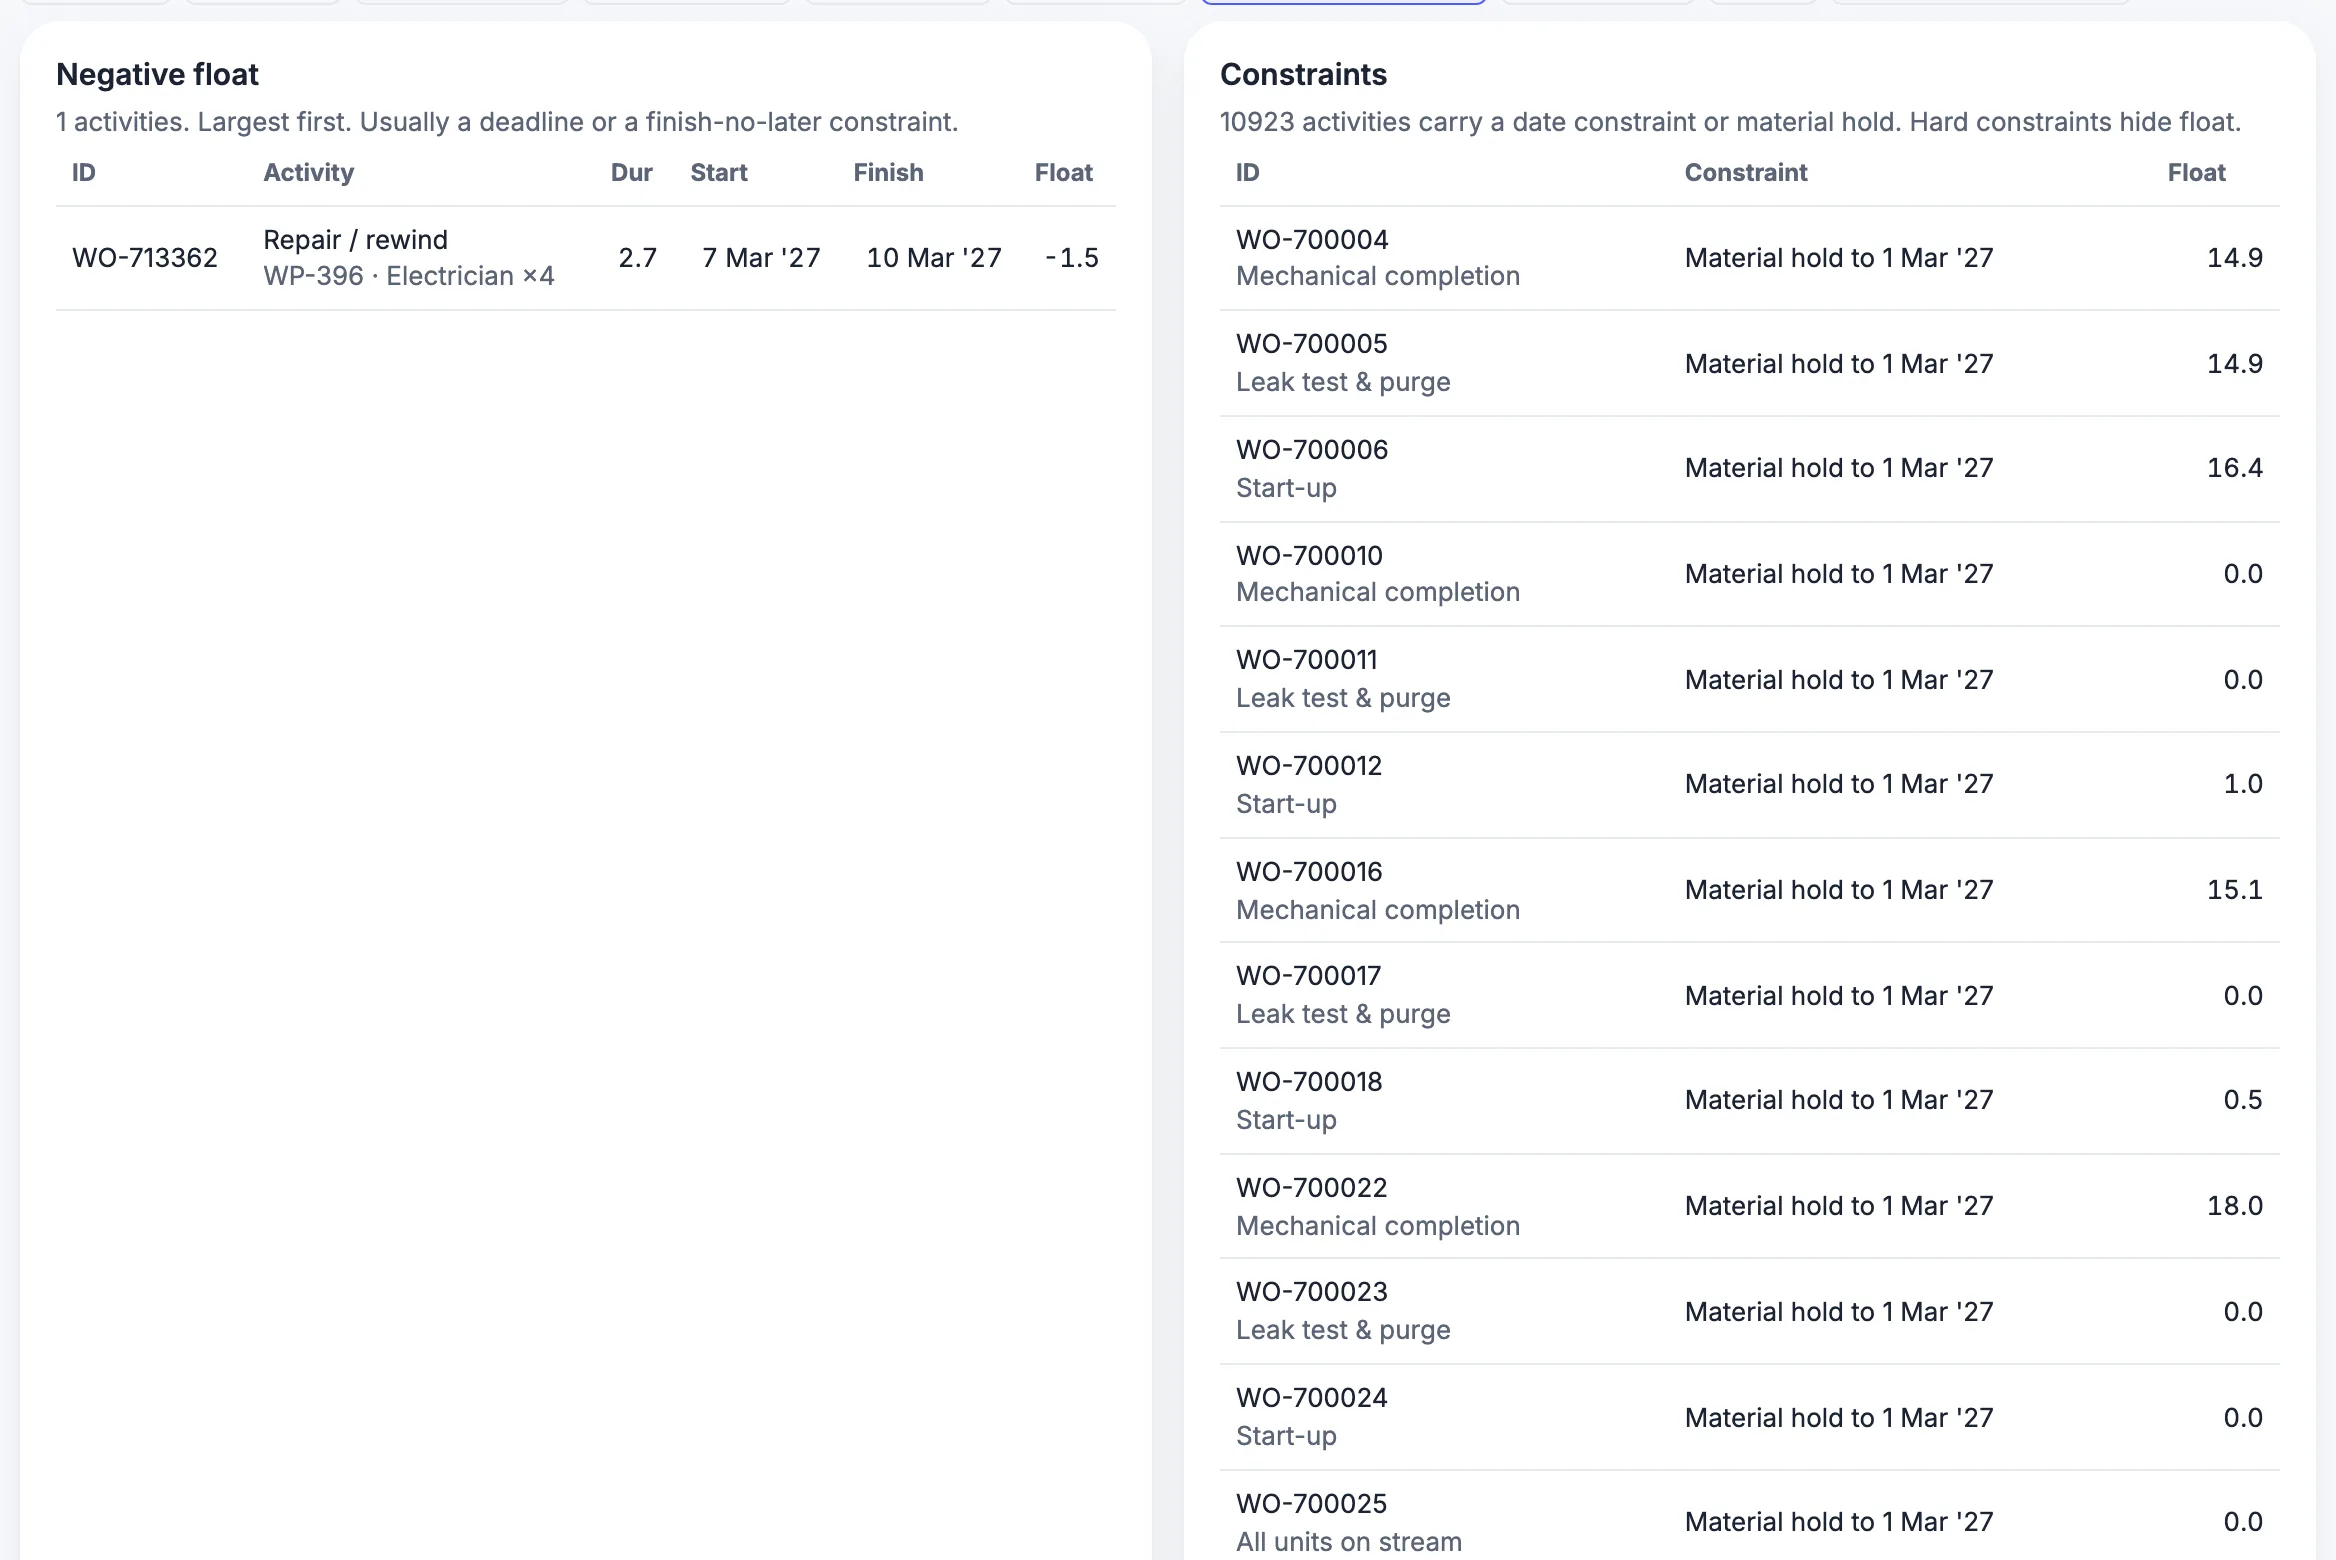
See also the other shutdown calculator tools. The Excel to Gantt tool shows the float of every task in a list.
Try it: how far does one late job move the finish?
Enter an activity's total float and how many days it slips. The result follows the schedule logic that GAO describes. Nothing is sent or stored; the sums run in your browser.
GAO also says float should not be treated as schedule contingency, because it is shared along a sequence of activities, and that management should closely monitor critical and near-critical activities. 1 The critical path method is explained in shutdown scheduling.
Software
Can software help prevent delays?
Software can show float, resource peaks, permit queues and material status against the schedule in one view, so the warnings above are visible before a job is late.
Float flags are listed in the shutdown module data sheet.
About MaintWiz. MaintWiz is an industrial AI platform with IoT, SAP integration and predictive maintenance (PdM) capabilities. Its shutdown and turnaround module helps plants plan, schedule, execute and close out shutdown work.
Also: product data sheet.
What the shutdown module covers
As described on the MaintWiz shutdown maintenance product page.
- Shutdown calendar and critical-path scheduling, with work order sequencing and dependencies
- Asset prioritization, so the most critical equipment is scoped first
- Resource planning for people, spares, heavy equipment such as cranes, and outsourced vendors
- Electronic permits to work, risk management and contingency plans
- Real-time progress monitoring: schedule adherence, cost variance, quality metrics and risk factors
- Step-by-step checklists, pre-restart testing protocols and post-shutdown analysis
Proof
What MaintWiz customers report
Figures as published in MaintWiz case studies on maintwiz.com. They come from maintenance management projects, not shutdowns.
Indicators
Which indicators warn that a shutdown is slipping?
The earliest warnings are float used up on near-critical jobs, critical-path jobs behind plan, a schedule performance index below 1.0, permits waiting for issue and kits incomplete for jobs due soon.
For what a delay costs, see planned vs unplanned shutdown cost.
Track a few of these every day and show them at the morning meeting. The index formulas are in shutdown KPIs and the daily routine in shutdown progress tracking. There is no published benchmark for any of them, so compare against your own previous shutdowns.
Recovery
How do you recover a shutdown that is falling behind?
Recover with a plan, not with float: re-sequence work, add shifts or crews to critical-path jobs only, defer work that can wait through the decision rule, and record why each change was made. GAO says float is shared and should not be used as contingency. 1
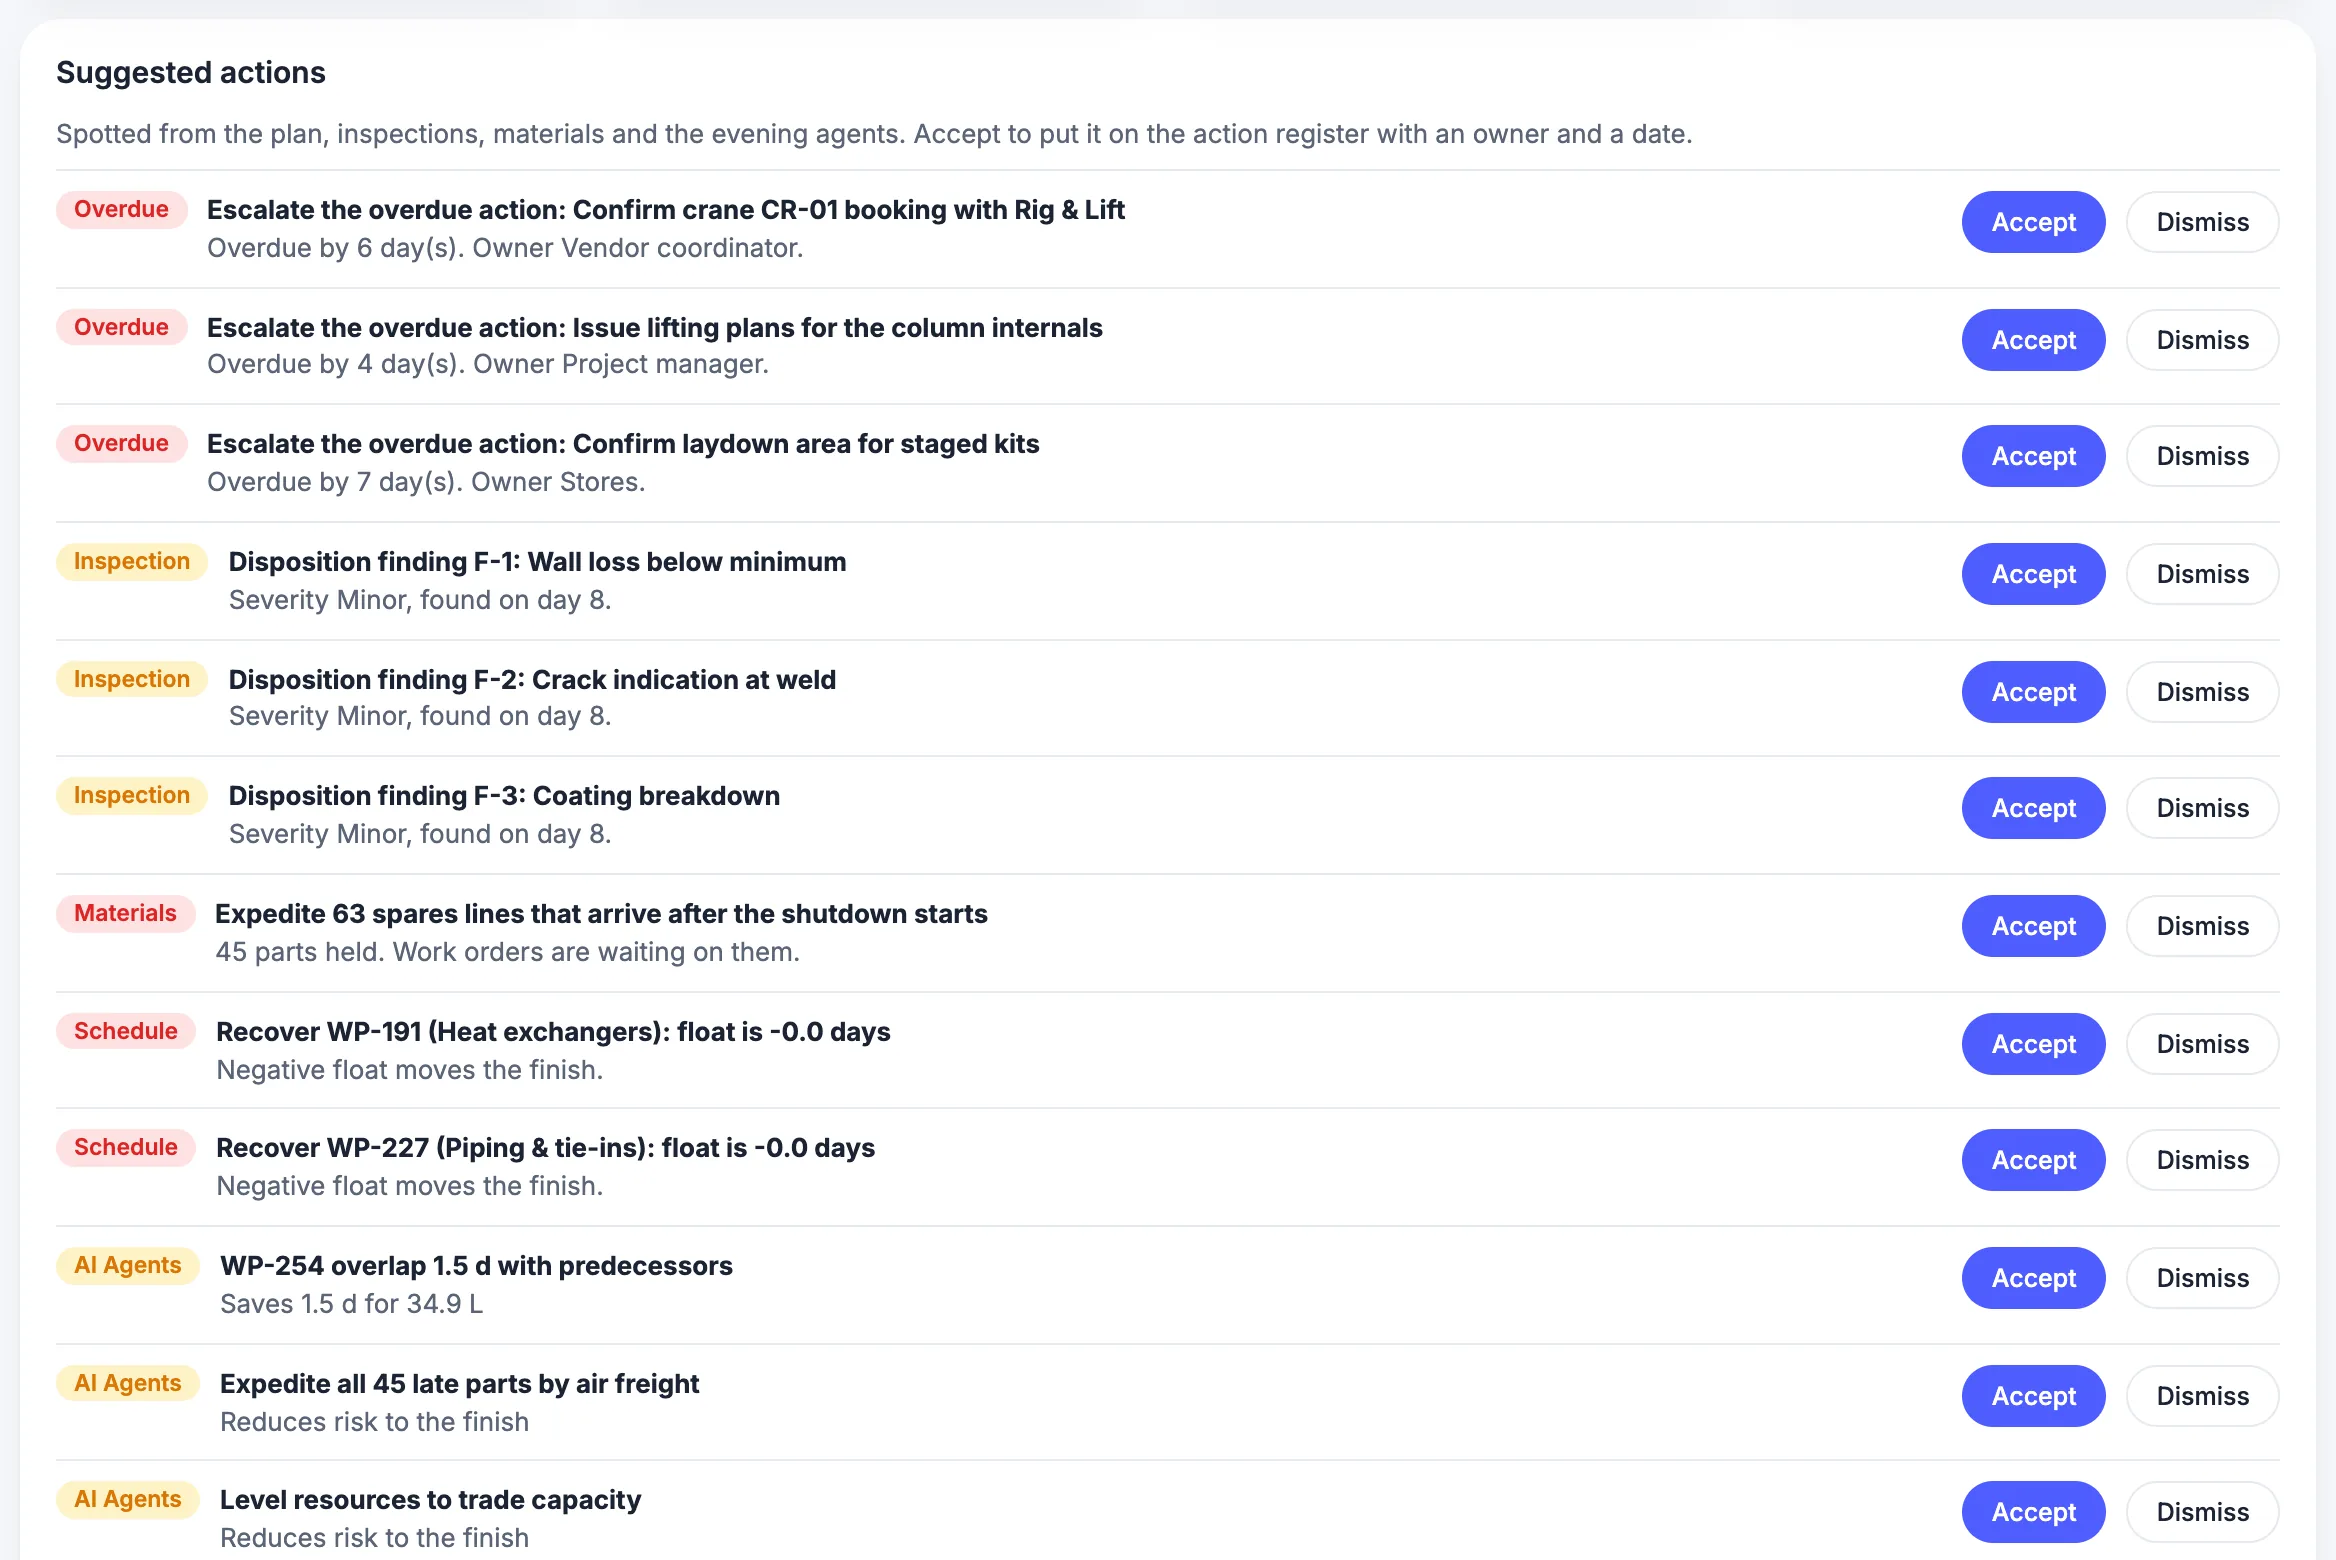
The arithmetic of float is worked in critical path vs critical chain. See critical path vs critical chain for the float arithmetic. For treatment plants and isolating one unit at a time, see water and wastewater plant outages. Spot a slip early with the schedule index and the three-day look-ahead in the shutdown S-curve and percent complete guide.
The decision rule for work found late is in shutdown execution, and scope control is in shutdown scope management. Recovery options are working guidance and each carries a cost; check the effect with your cost forecast in shutdown budget planning.
Evidence
How often do shutdown schedules overrun?
There is no published figure for how often shutdown schedules overrun, or by how much,, so this page gives none.
Refueling outages show the spread: US averages and longest outages are in nuclear refueling outage planning. A worked example of a late finish: shutdown case study planned vs actual duration.
Power-plant reporting shows how one sector treats overruns: NERC says extra time on a task that was in the original scope is a planned extension, while extra time to repair damage found during an inspection is coded as a forced outage. 2 Earlier versions of this page said the data was sobering without citing any; that was removed. Cost overruns are covered in why shutdowns go over budget.
Visuals
Save the delay charts
Two charts for the daily meeting. Click either for the full-size image.
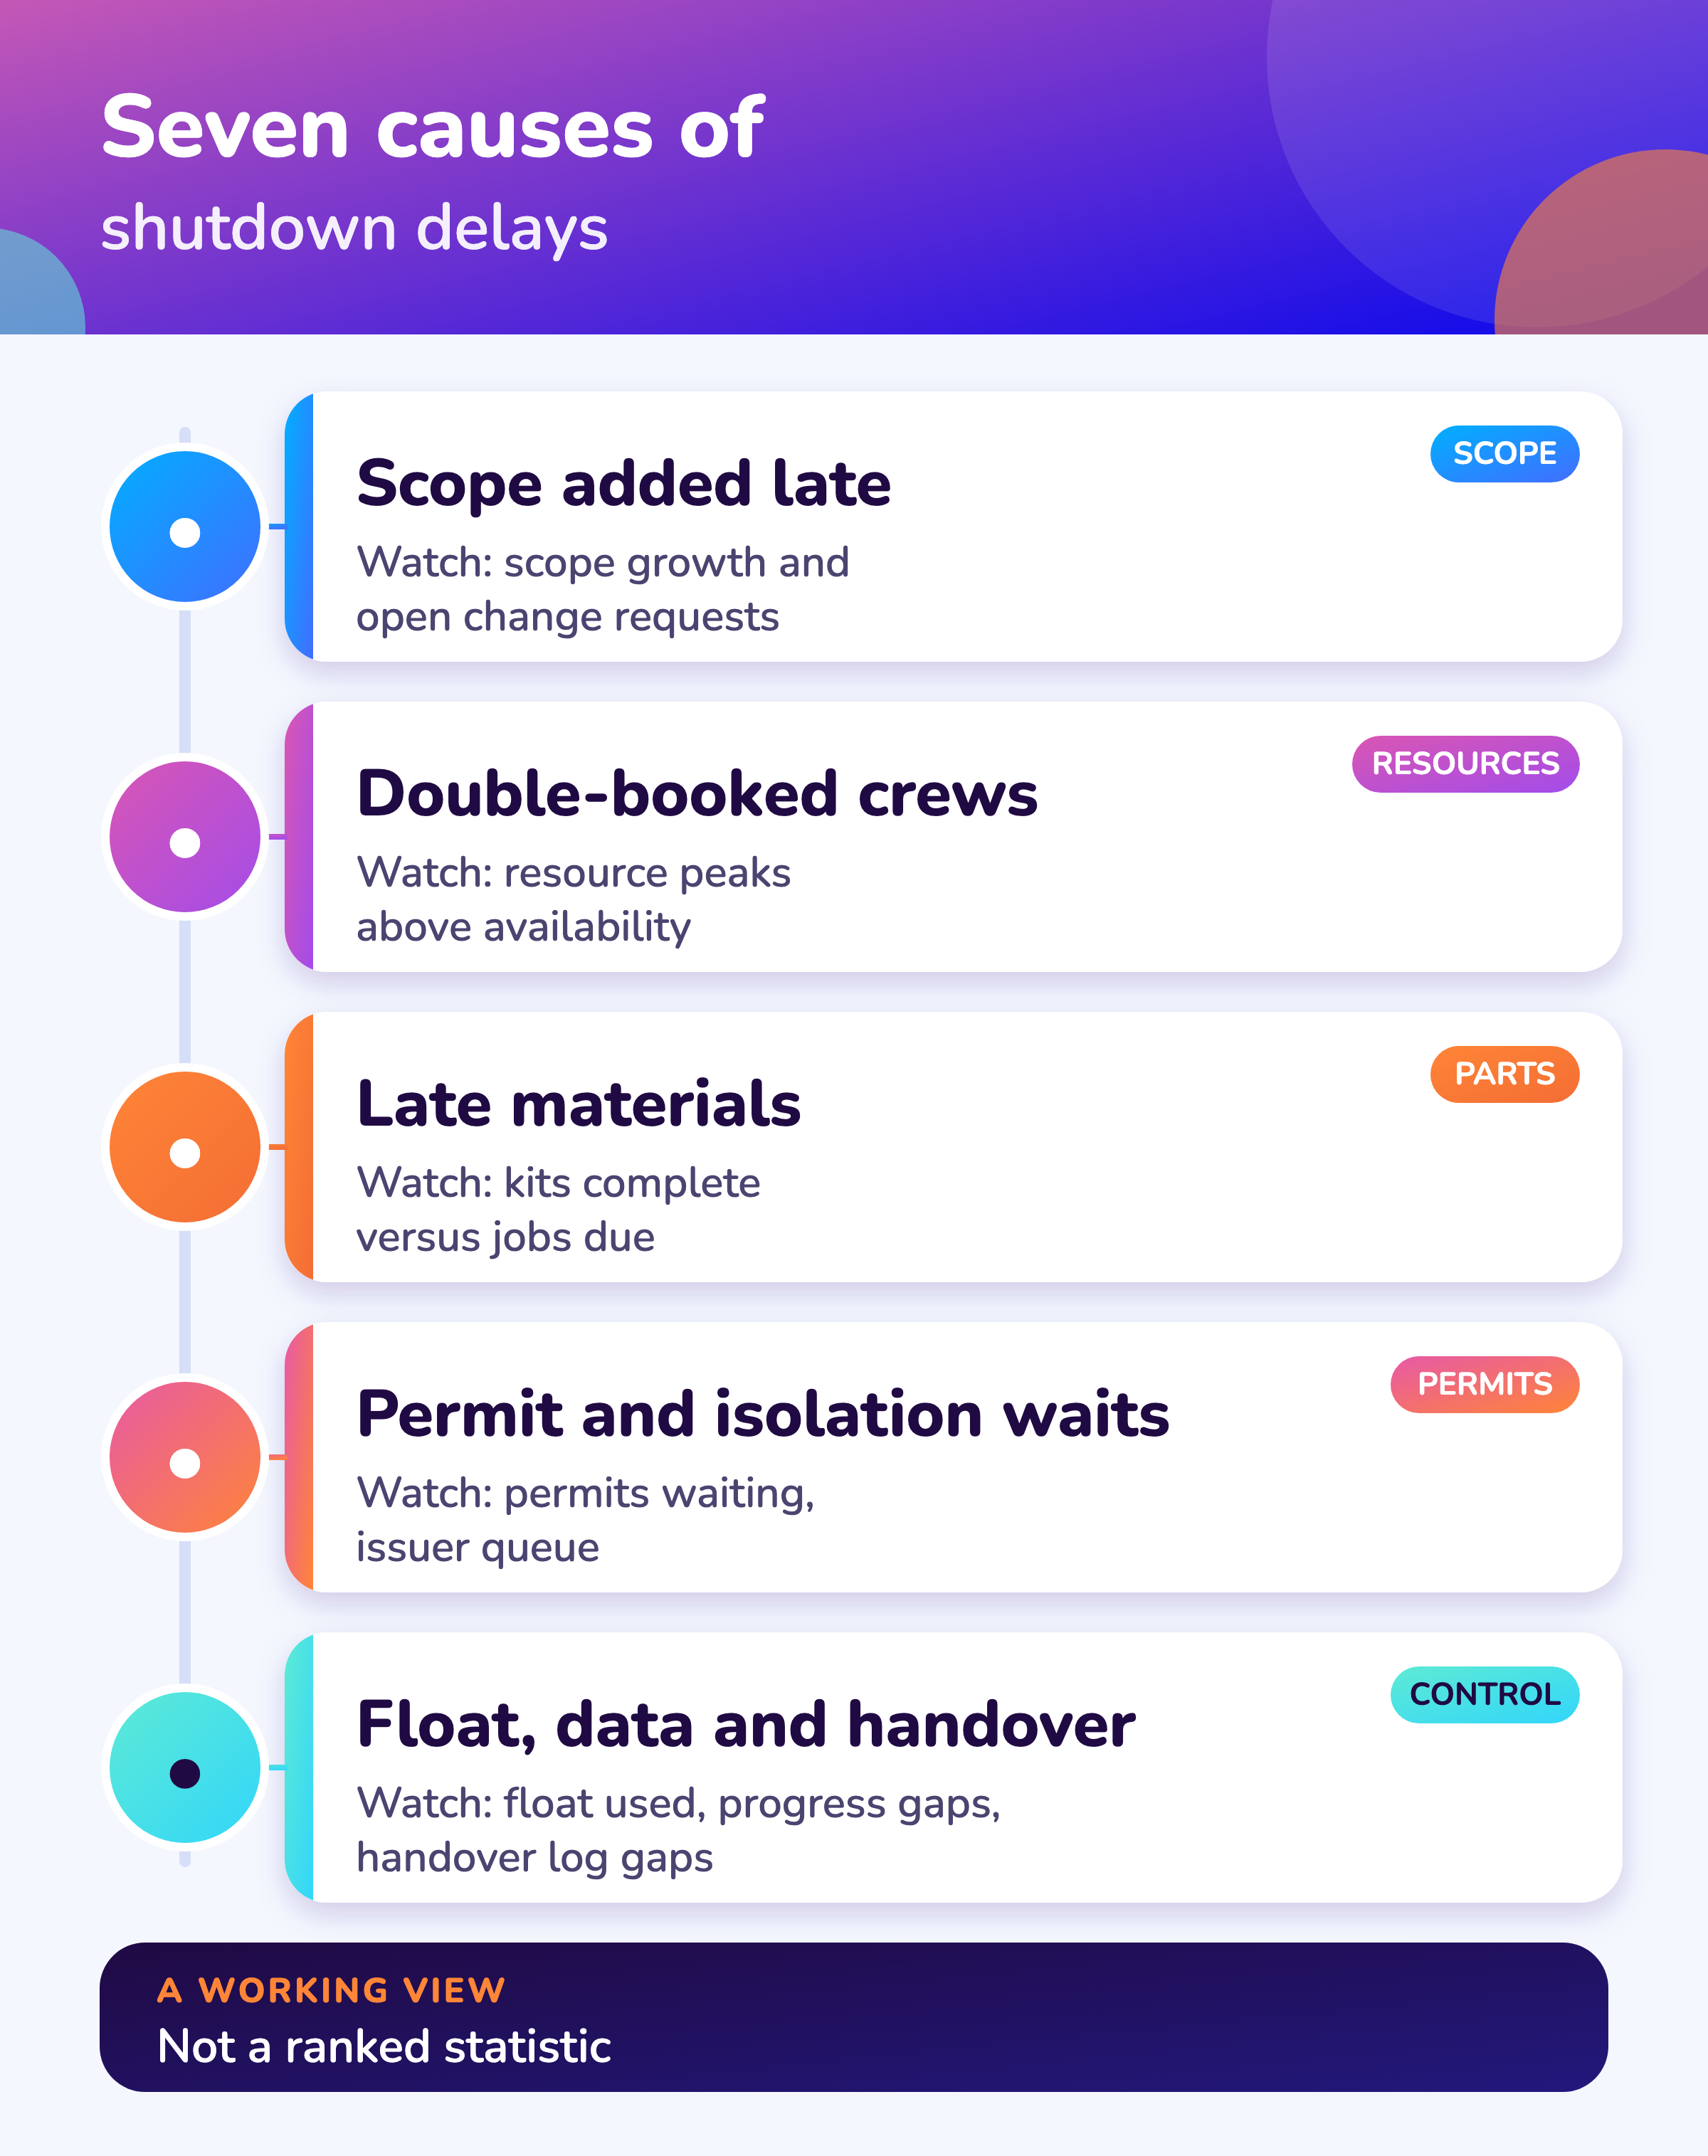
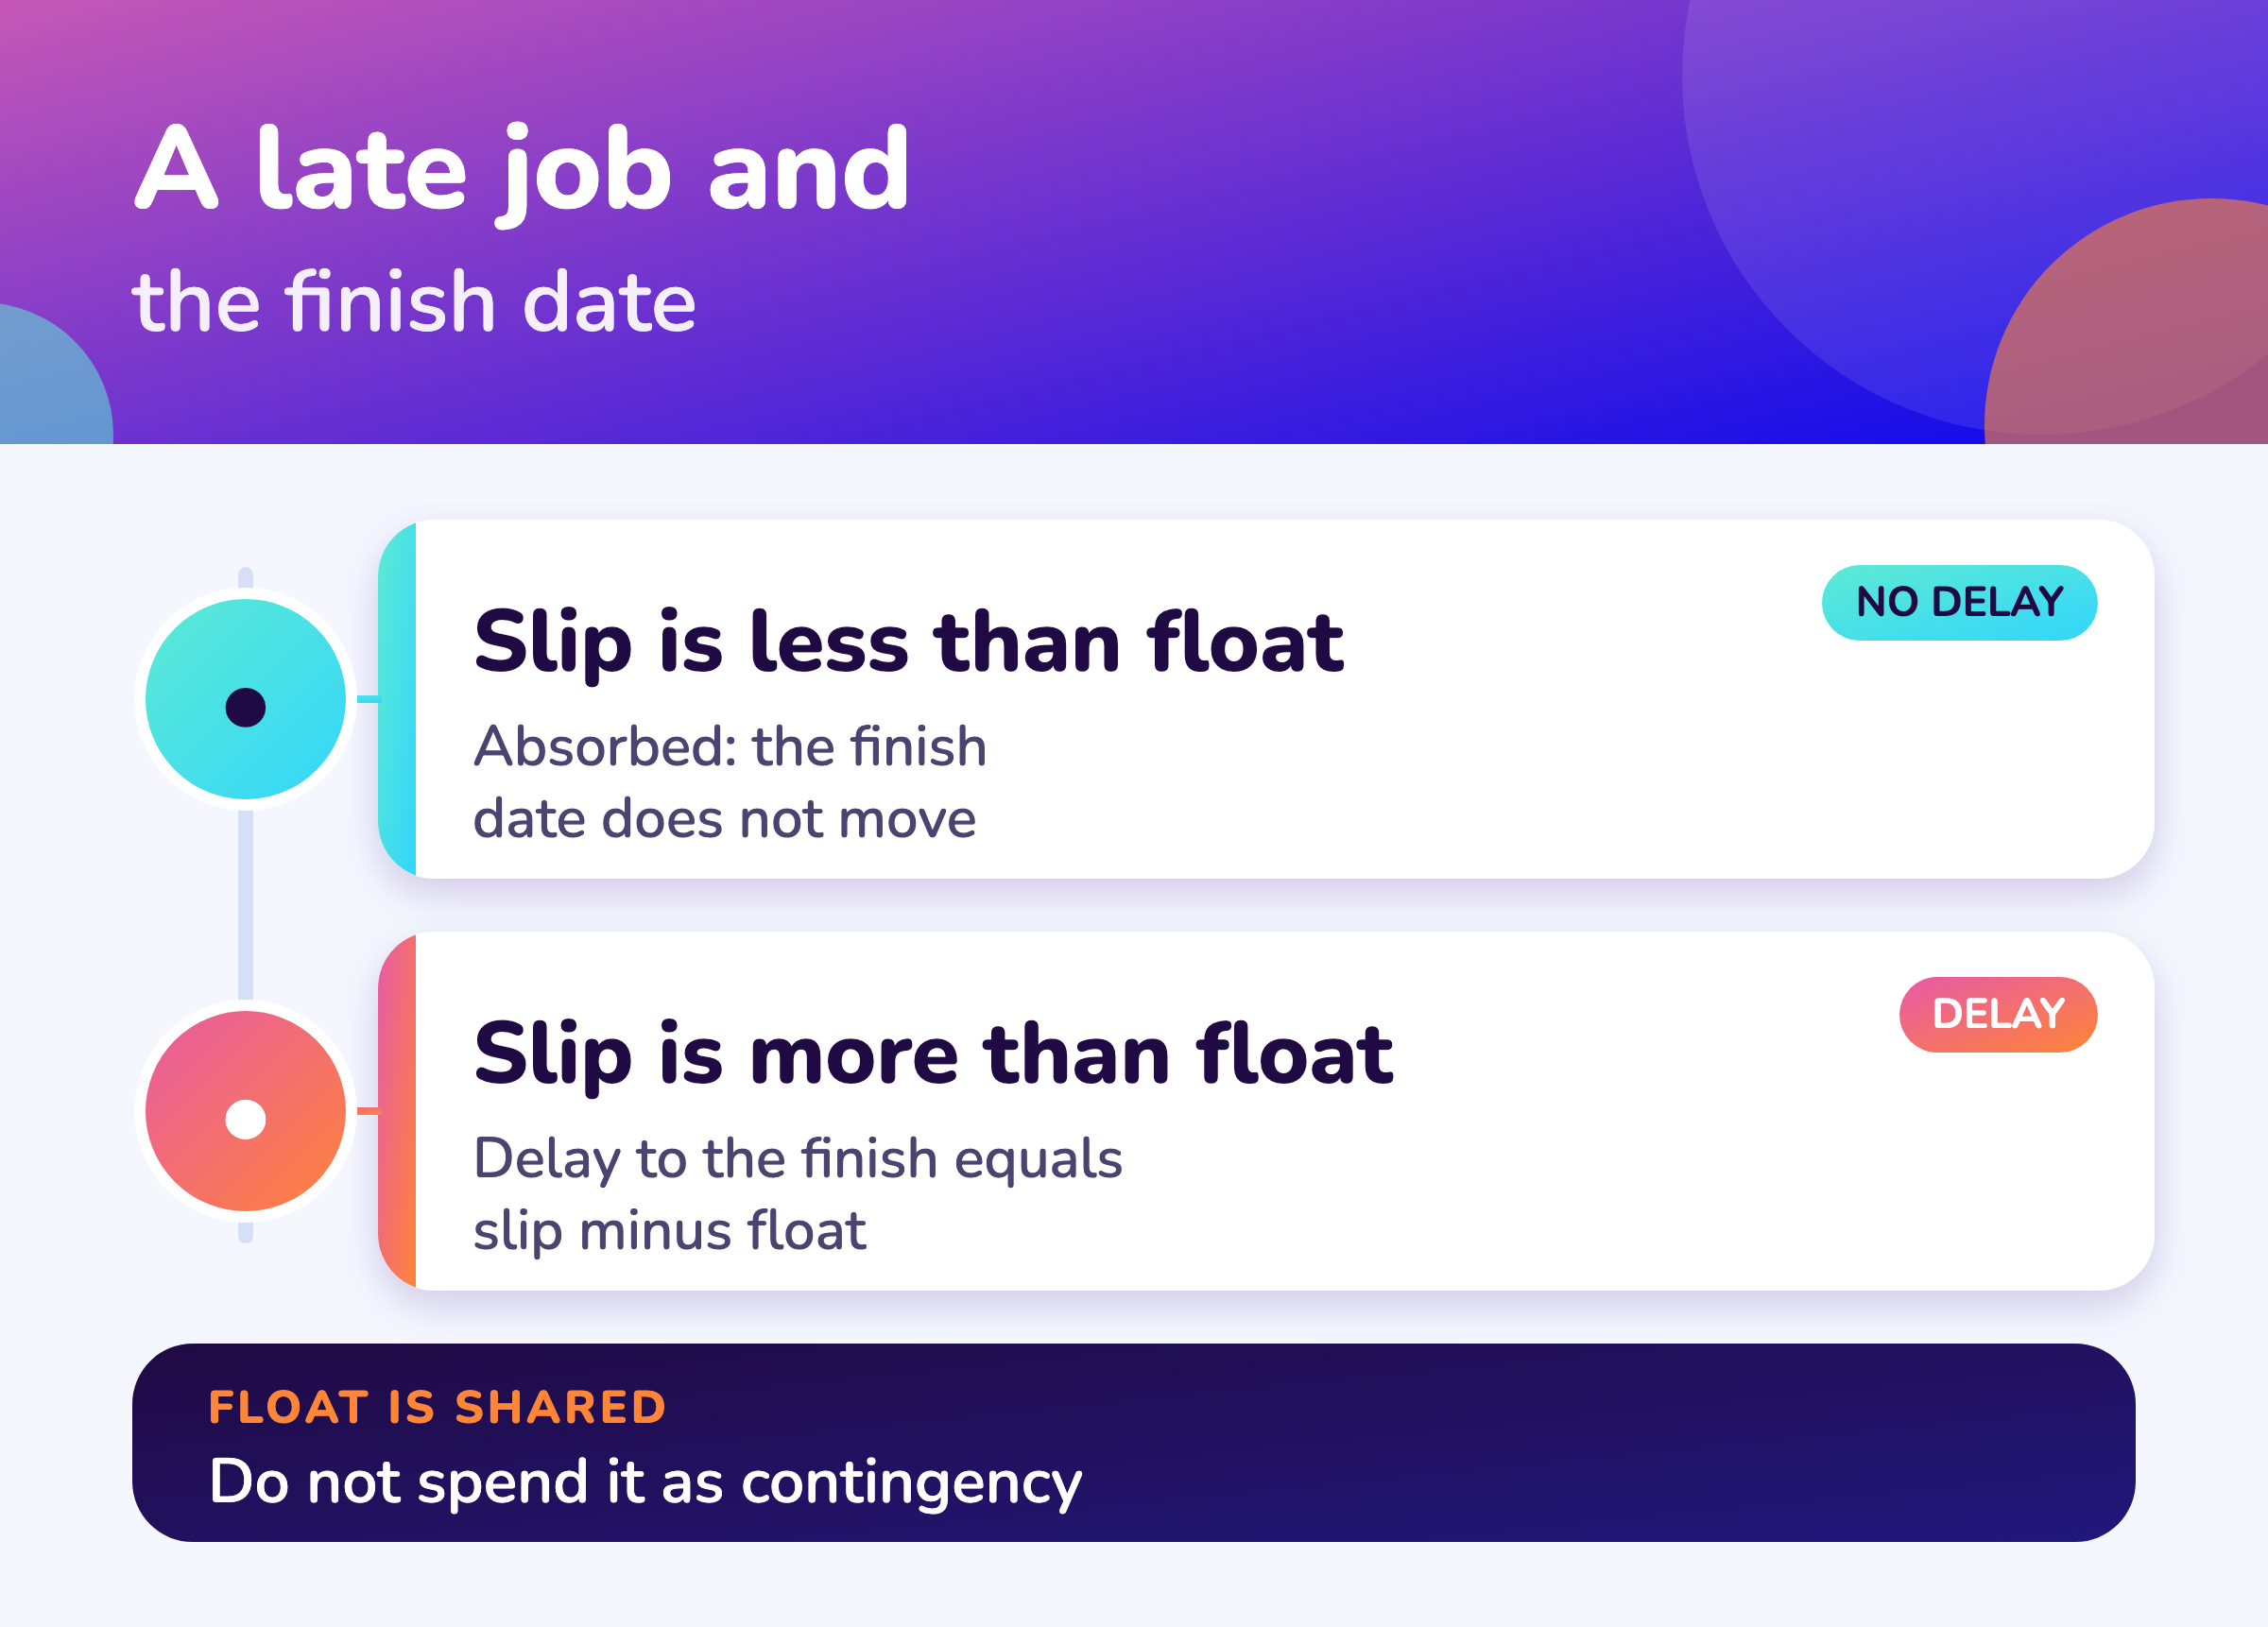
FAQ
Frequently asked questions
What are the main causes of shutdown delays?
Scope added after the freeze, double-booked crews, late materials, permit and isolation waits, logic and float errors, unreliable progress data and shift handover failures. 1,2,4
When does a late job delay the whole shutdown?
When its slip exceeds its total float. GAO defines total float as the time an activity can slip before its delay affects the end date. 1
Can float be used as contingency?
No. GAO says float should not be treated as schedule contingency because it is shared along a sequence of activities. 1
How do you recover a delayed shutdown?
Re-sequence work, add shifts or crews to critical-path jobs only, defer work that can wait and record each change. Recovery options are working guidance and each has a cost.
Why is percent complete unreliable?
GAO says it is subjective, and more so for long activities. Measure completed steps against actual dates instead. 1
How do permit delays cause schedule delays?
HSE notes that permit supervision thins when many permits sit with one person at shutdown peaks, so jobs wait. It advises limiting active permits or adding resource. 4
What does a shift handover failure cost?
There is no published cost figure. HSE says many accidents followed communication failures at handover and that most involved planned maintenance work. 5
How much do shutdown schedules overrun?
There is no published figure. Track your own duration variance with the formula in the KPI guide.
Sources
Sources
Statements come from the GAO, NERC and HSE sources as cited. The cause table and the recovery options are working analysis, and the page says so. Check the sources for later revisions.
- US Government Accountability Office, GAO Schedule Assessment Guide: Best Practices for Project Schedules (GAO-16-89G, December 2015)
- North American Electric Reliability Corporation, Generating Availability Data System (GADS) Data Reporting Instructions, effective 1 January 2026
- UK Health and Safety Executive, The safe isolation of plant and equipment (HSG253, 2006)
- UK Health and Safety Executive, Guidance on permit-to-work systems: a guide for the petroleum, chemical and allied industries (HSG250, 2005)
- UK Health and Safety Executive, Human factors: Shift handover
Put your shutdown schedule in one plan
Book a demo and bring your shutdown schedule. We will show how the module handles the critical path, float and baselines.