
Daily management
Shutdown Progress Tracking: Daily Report and S-Curve
To track shutdown progress, measure completed steps and actual dates against the baseline, report every job to one status date, plot planned and actual progress on an S-curve and review it at a short daily meeting. A one-page daily report and a simple forecast turn the numbers into decisions.
Daily management is part of phase 4 of the five-phase model, with project control running through it.
How MaintWiz helps: Daily meetings work best on live status, not yesterday's spreadsheet. The MaintWiz shutdown module gives technicians checklists with readings and photos, sends findings to the planner and shows a Today view of what needs attention. See the module · Get the daily progress template
By Jai Balachandran · Published · Last reviewed
What MaintWiz adds:Today page for the plannerChecklists with readings and photosFindings to the plannerHandover notes and as-left summary
Measuring
How should shutdown progress be measured?
Measure progress by completed steps and actual dates, not by a supervisor's feeling of percent complete, and report every job to one status date. GAO's schedule guide explains why percent-complete estimates are subjective. 1
Measure completed steps
GAO notes that percentage complete is subjective, and more so for long activities: 25 percent complete may be viable for a 4-day activity but is ambiguous for a 50-day one. 1
Record actual dates
GAO describes updating the schedule with actual progress and logic, so the plan shows what really happened and what is left. 1
Use one status date
GAO measures the remaining critical path from the current status date to the finish, so everyone should report to the same cut-off time. 1
Control the baseline
GAO says baseline and current schedules should go through change control, or staff keep revising the plan to match performance. 1
Break long jobs into steps of a day or less that are either done or not done. The critical path and float that the updates feed are explained in shutdown scheduling.
The meeting
How should the daily shutdown meeting run?
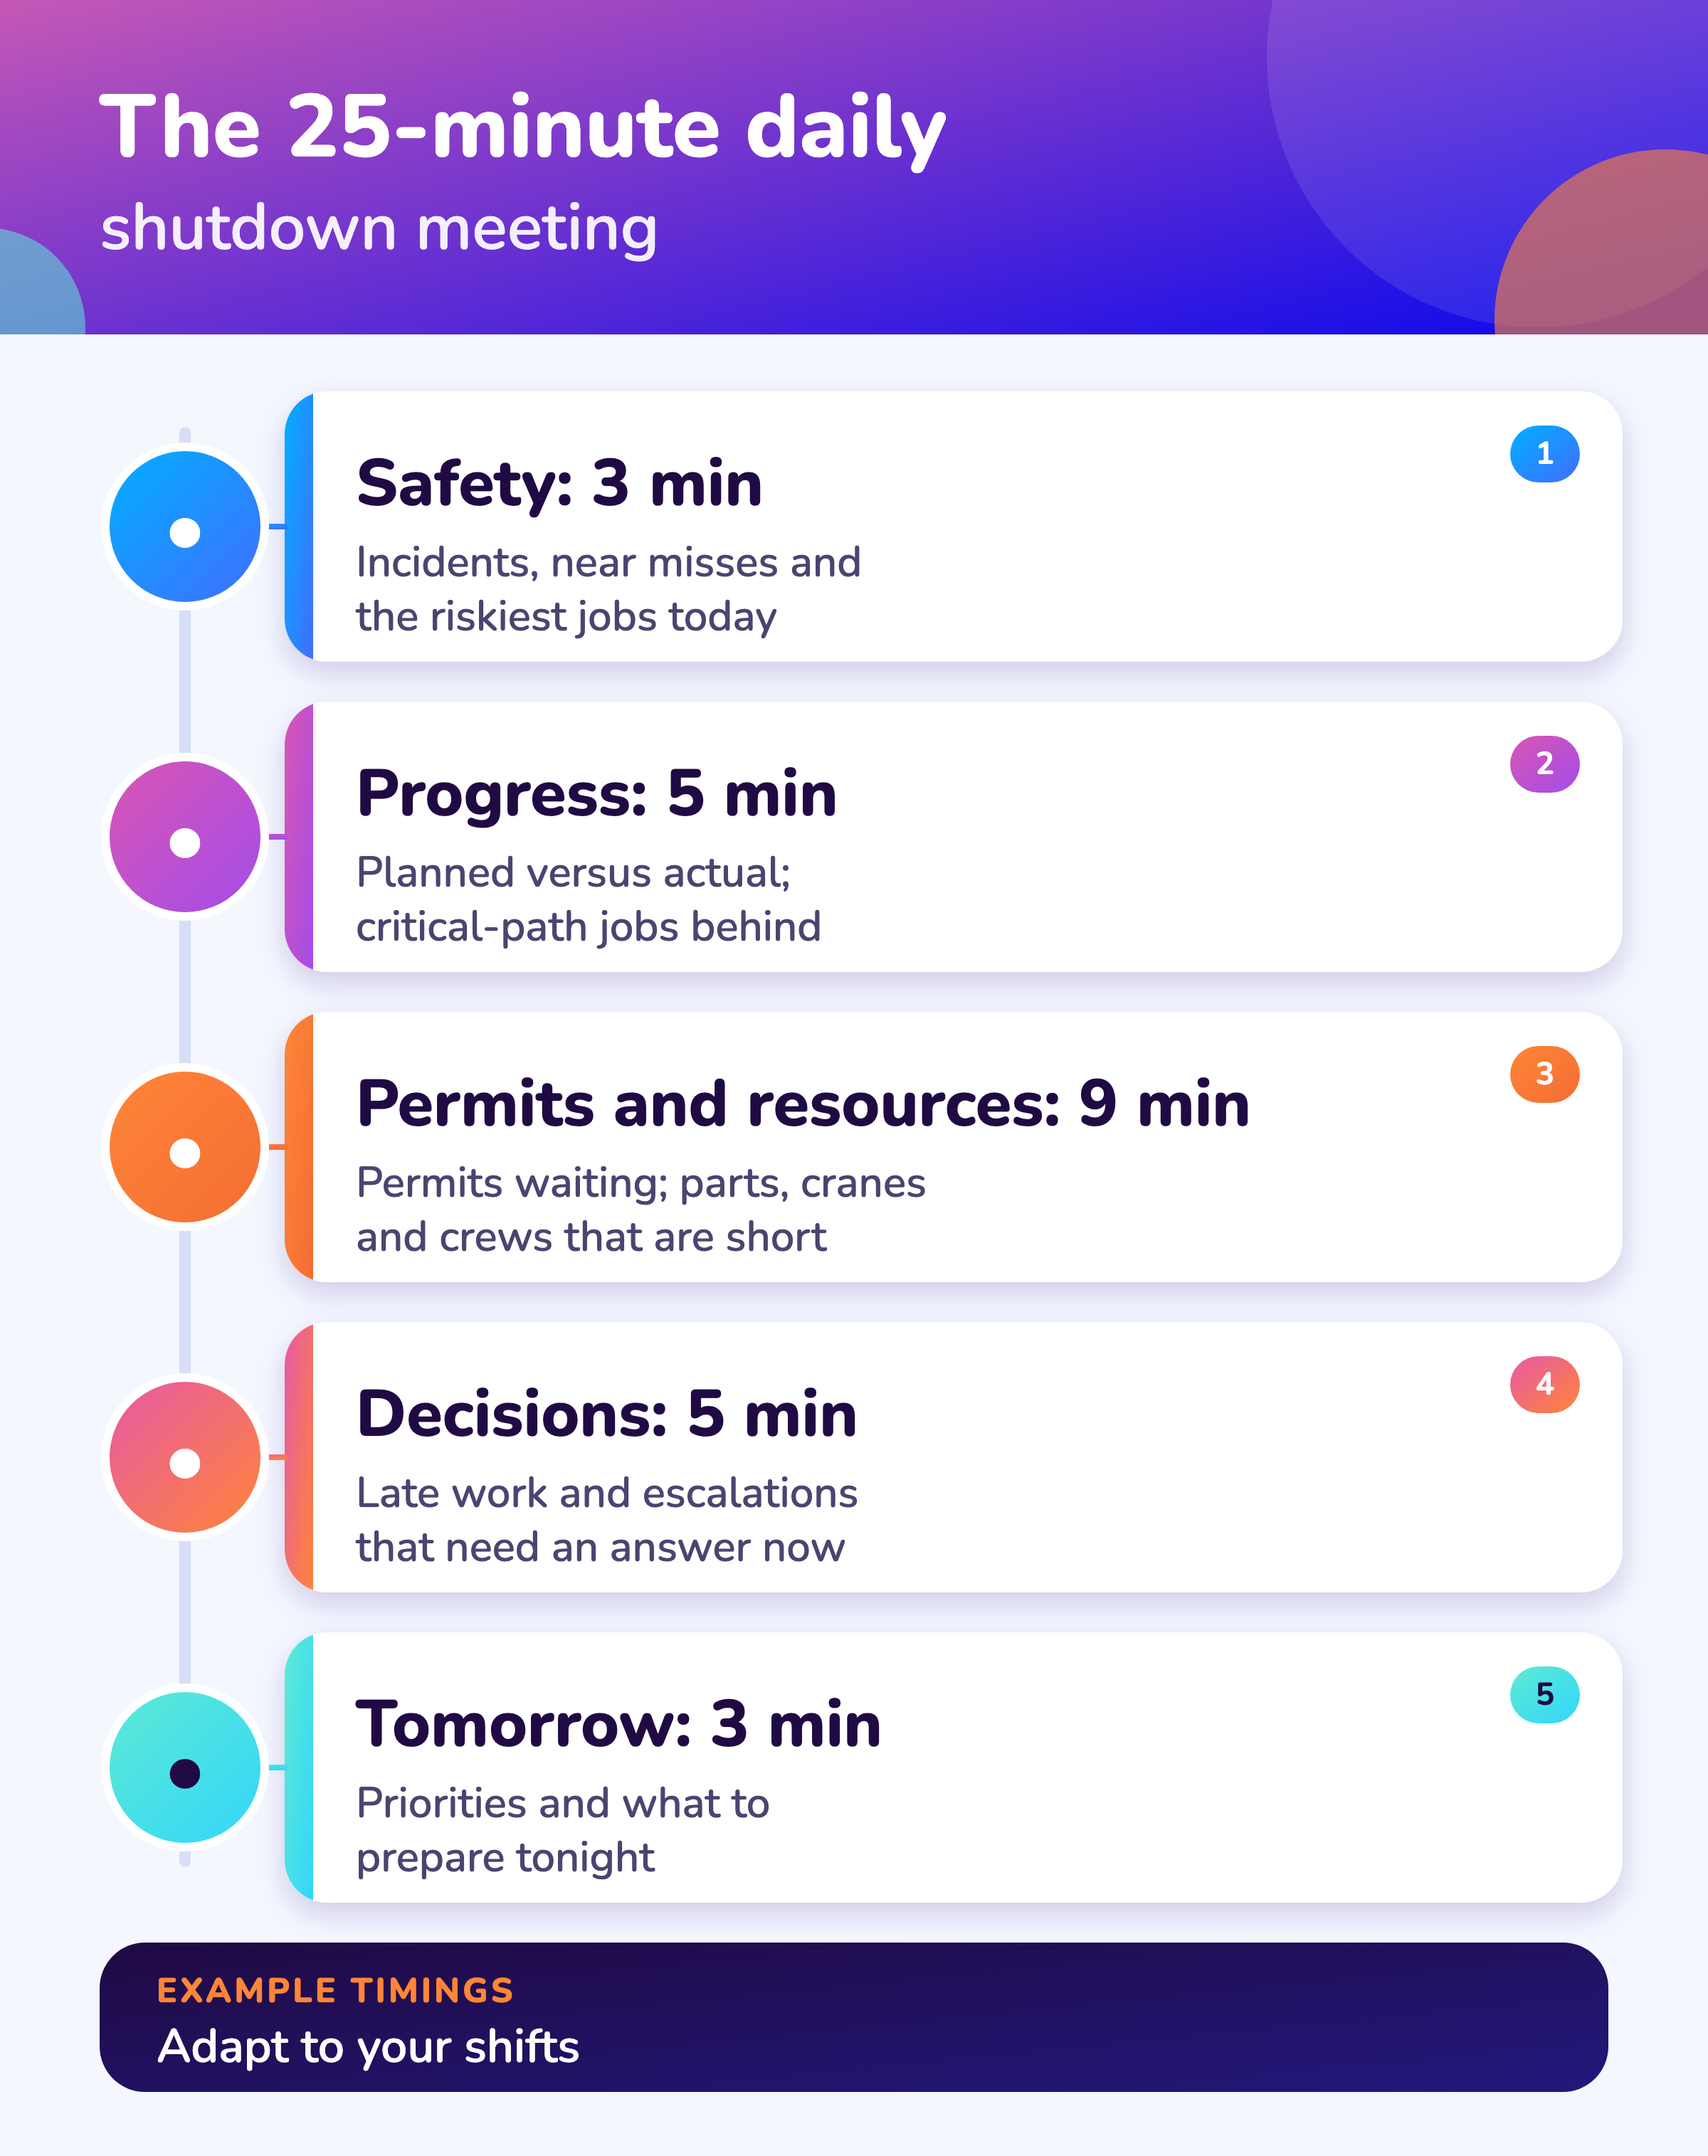
The daily meeting should be short, run to a fixed agenda at the same time every day, and finish with decisions recorded rather than with open discussion. HSE says handovers between shifts should be face to face, two-way and given enough time. 3
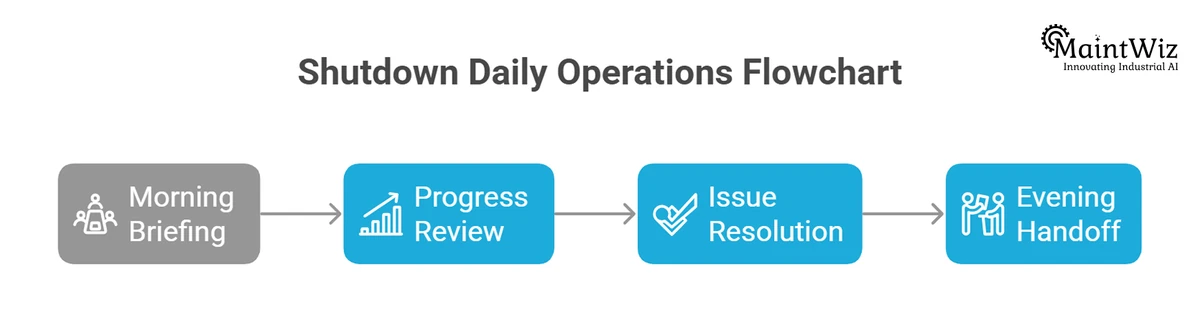
| Minutes | Item | What is covered |
|---|---|---|
| 3 | Safety | Incidents and near misses since the last meeting; today's highest-risk jobs |
| 5 | Progress against the plan | Planned versus actual progress; critical-path jobs behind plan |
| 5 | Permits and isolations | Permits live, waiting on isolation, or waiting on a test |
| 4 | Materials and resources | Parts, cranes and crews that are short today |
| 5 | Decisions | Late work, scope changes and escalations that need a decision now |
| 3 | Tomorrow | Priorities and anything to prepare tonight |
Software
Can software track shutdown progress?
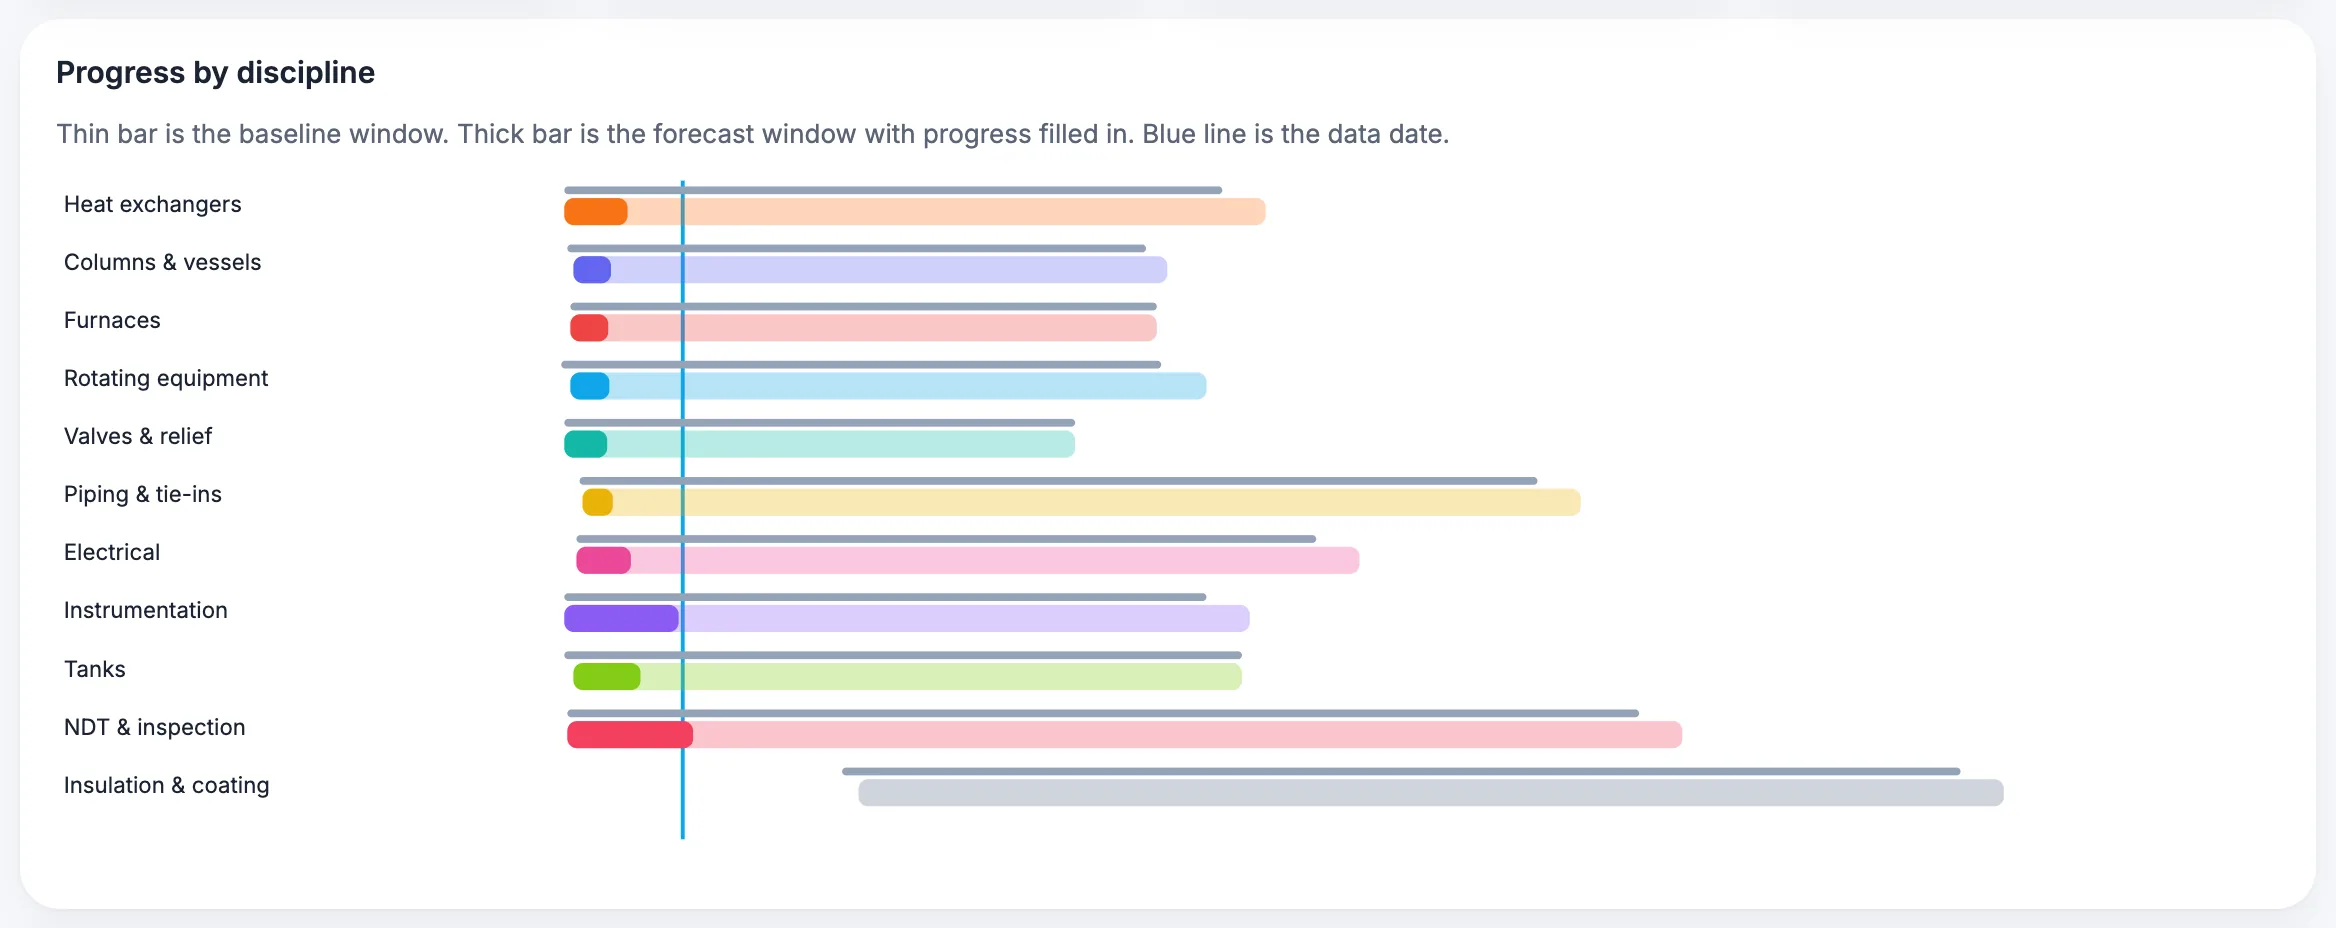
Software can capture progress at the job, show planned against actual on one screen and produce the daily report from the same records, so the meeting starts from the data and not from a spreadsheet rebuilt overnight.
For the full feature list, see the MaintWiz shutdown module data sheet.
About MaintWiz. MaintWiz is an industrial AI platform with IoT, SAP integration and predictive maintenance (PdM) capabilities. Its shutdown and turnaround module helps plants plan, schedule, execute and close out shutdown work.
Also: product data sheet.
What the shutdown module covers
As described on the MaintWiz shutdown maintenance product page.
- Shutdown calendar and critical-path scheduling, with work order sequencing and dependencies
- Asset prioritization, so the most critical equipment is scoped first
- Resource planning for people, spares, heavy equipment such as cranes, and outsourced vendors
- Electronic permits to work, risk management and contingency plans
- Real-time progress monitoring: schedule adherence, cost variance, quality metrics and risk factors
- Step-by-step checklists, pre-restart testing protocols and post-shutdown analysis
Proof
What MaintWiz customers report
Figures as published in MaintWiz case studies on maintwiz.com. They come from maintenance management projects, not shutdowns.
The S-curve
What is an S-curve and how do you read it?
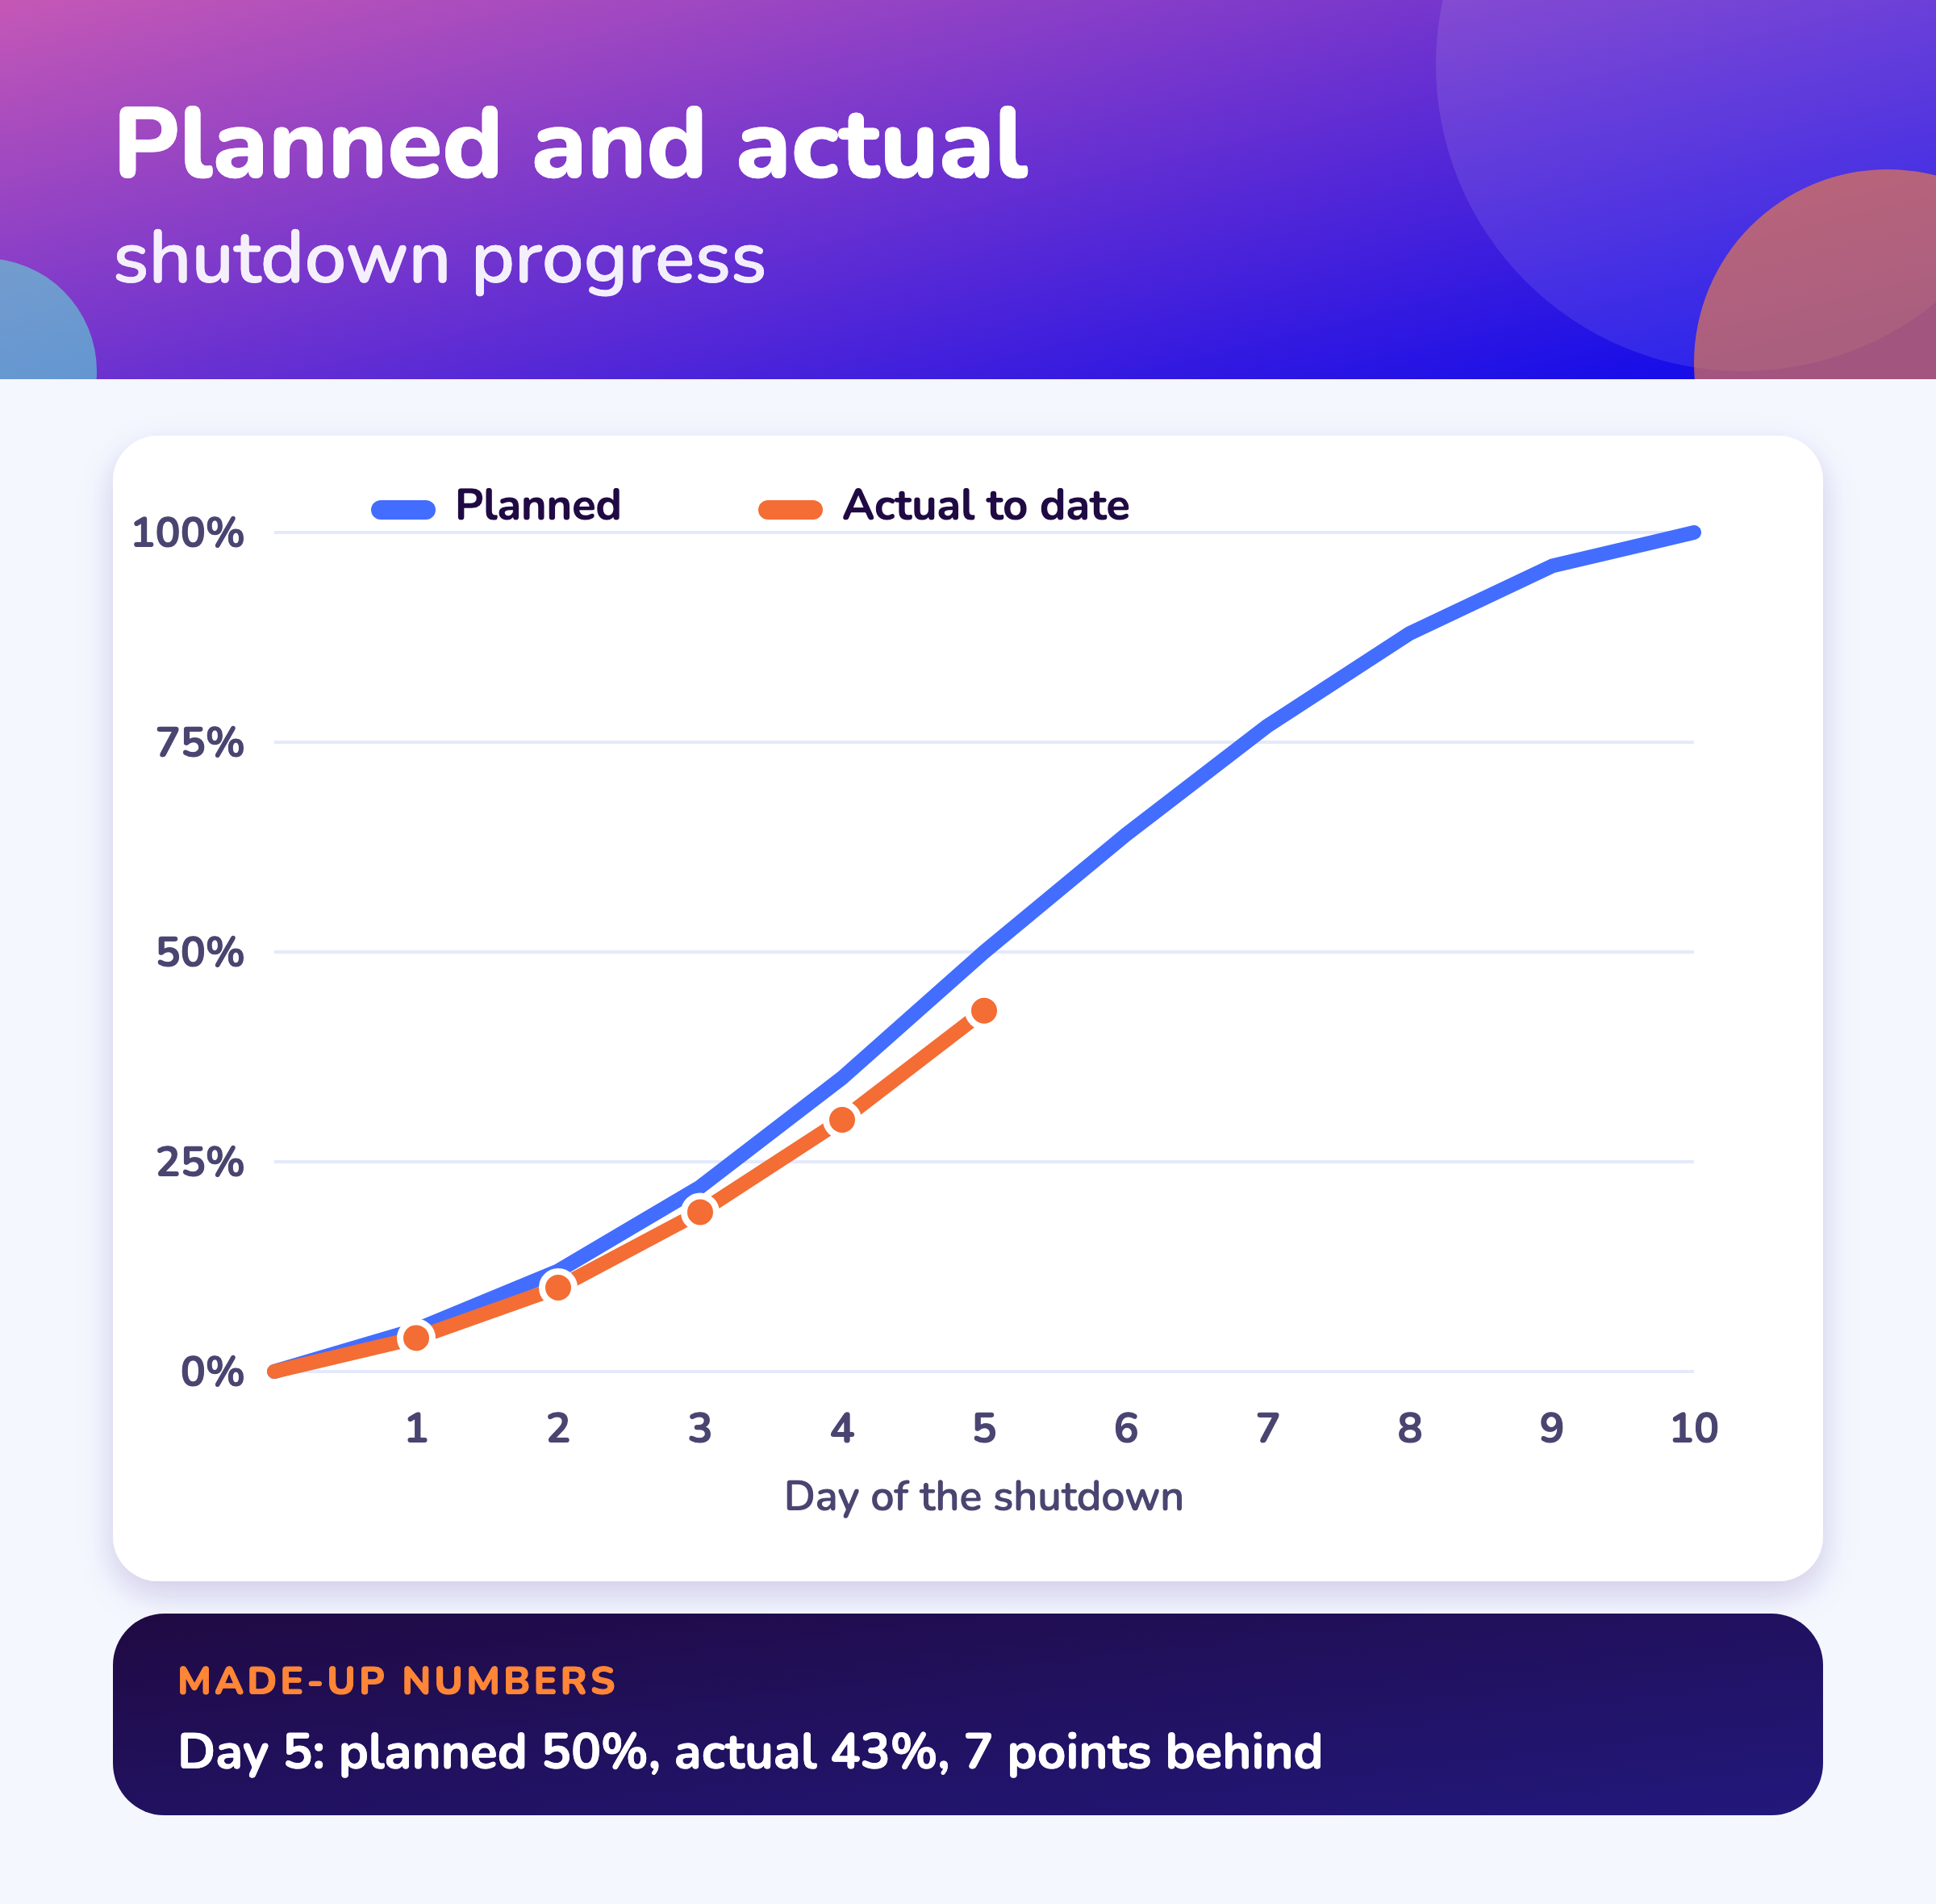
An S-curve plots cumulative planned progress and cumulative actual progress against time; it is S-shaped because work builds up, peaks and tails off, and a gap between the two lines shows how far ahead or behind the shutdown is.
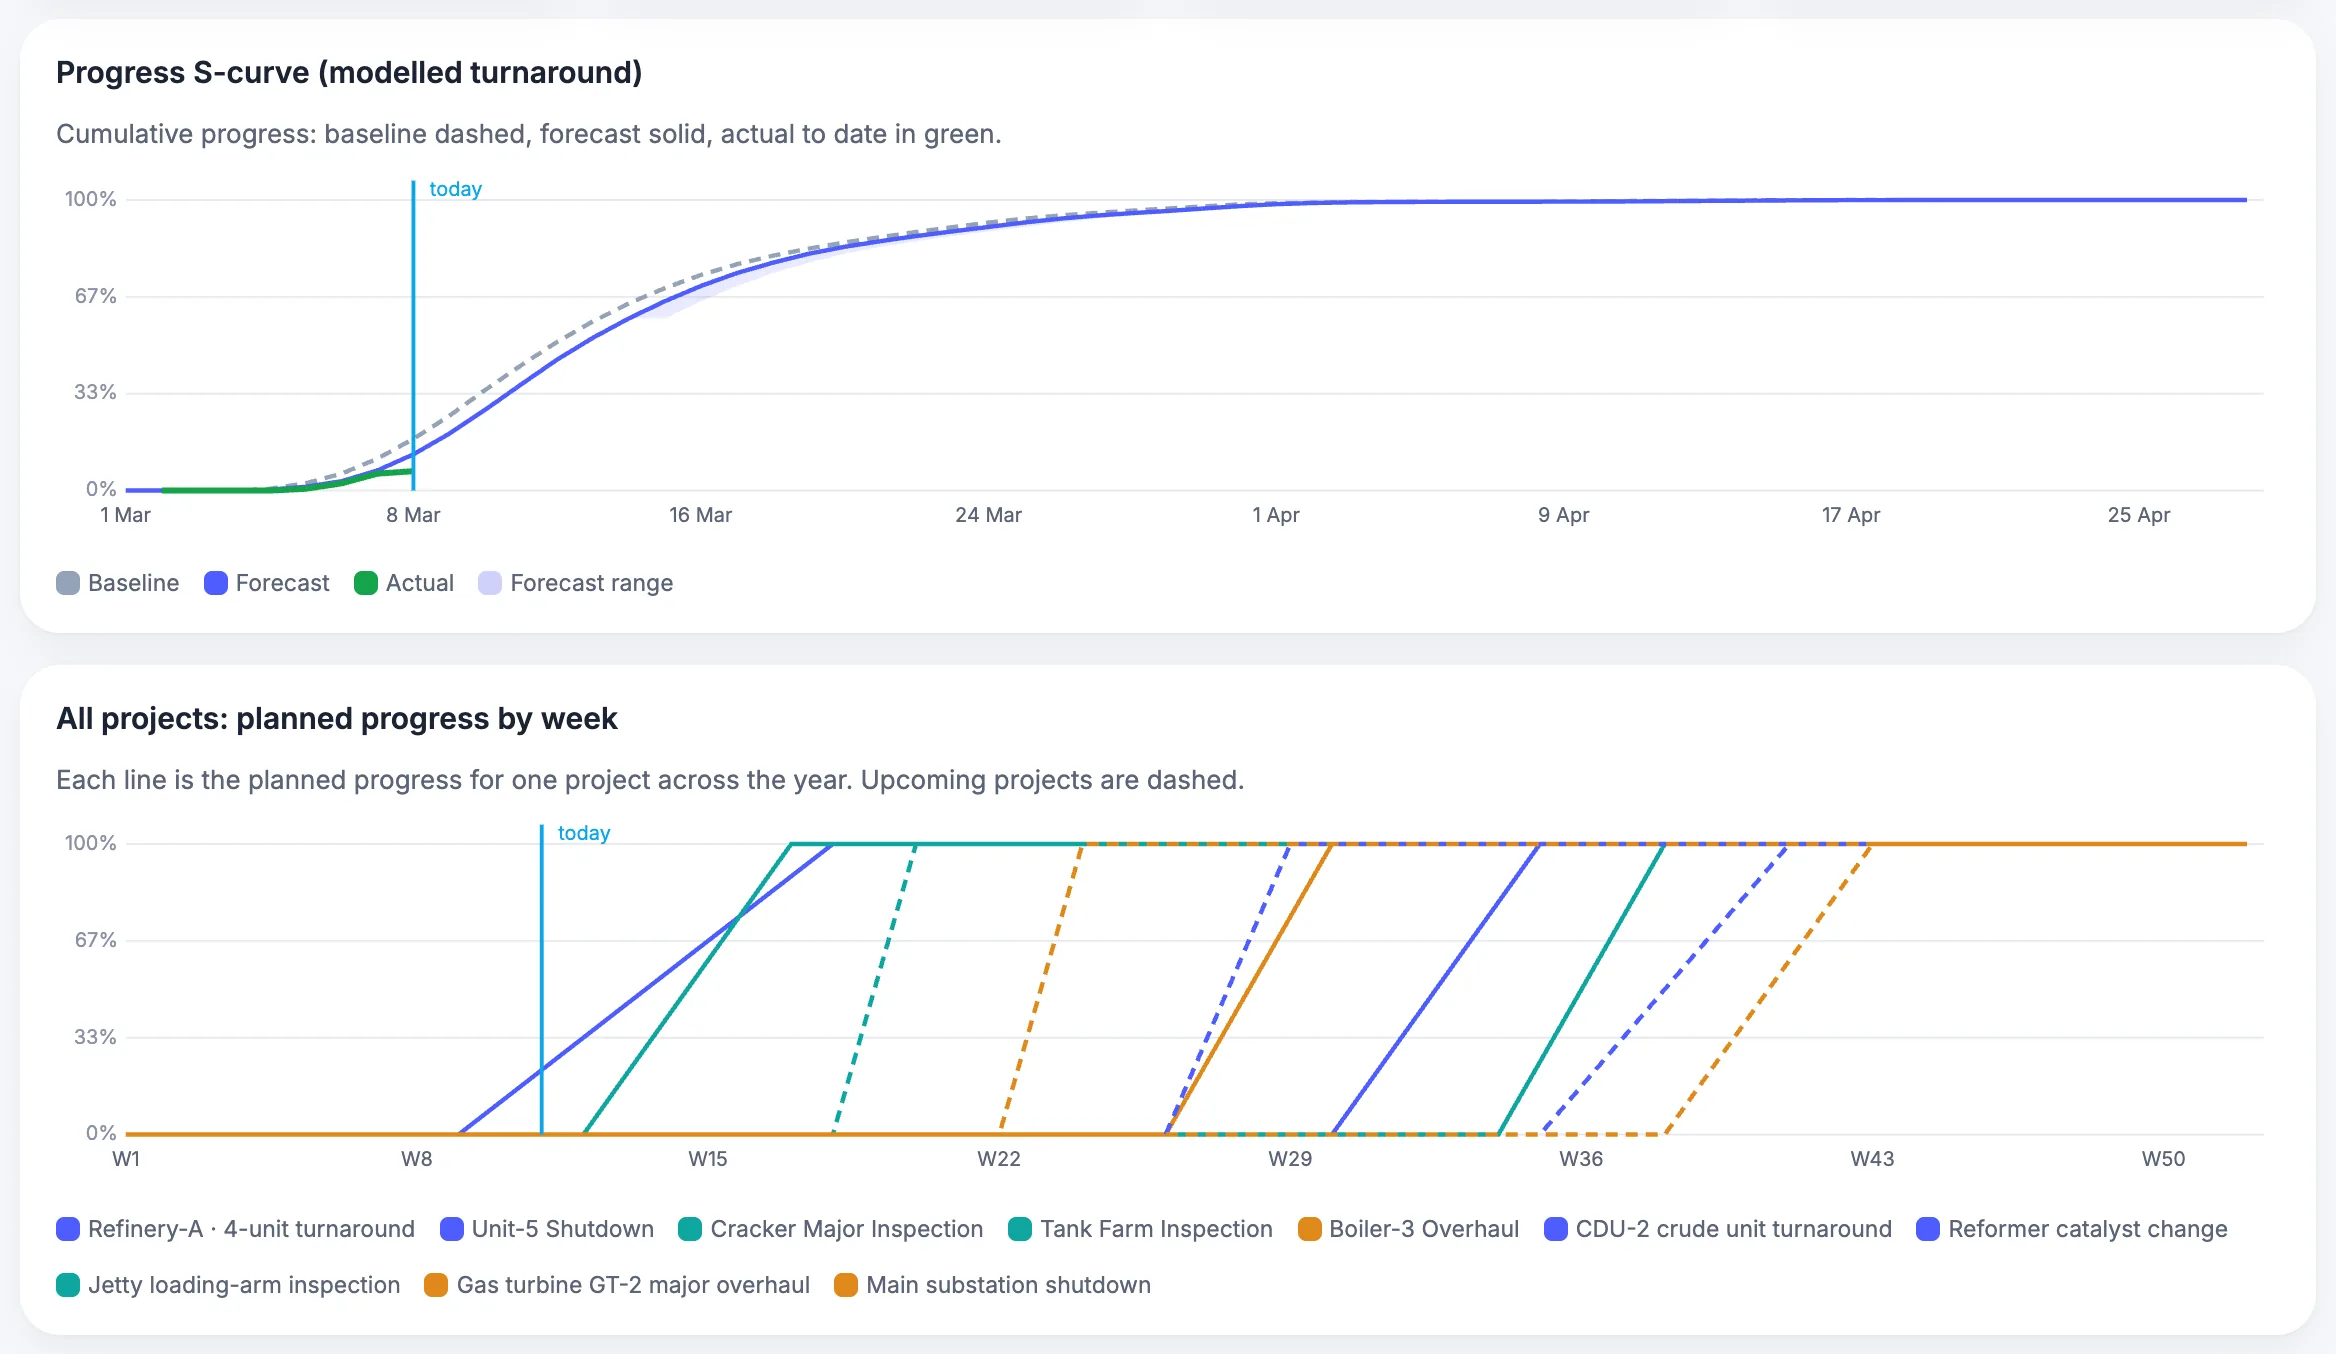
Planned dates for the S-curve can come from the Excel to Gantt tool. See a planned versus actual review in the shutdown case study. For percent complete rules, the schedule index and the three-day look-ahead, see the shutdown S-curve and percent complete guide.
The numbers below are made up. By the end of day 5 the plan called for 50 percent complete and the job stood at 43 percent, so it is 7 percentage points behind and has delivered 0.86 of the planned progress to date (43 divided by 50).
| Day | 1 | 2 | 3 | 4 | 5 | 6 | 7 | 8 | 9 | 10 |
|---|---|---|---|---|---|---|---|---|---|---|
| Planned, % complete | 5 | 12 | 22 | 35 | 50 | 64 | 77 | 88 | 96 | 100 |
| Actual, % complete | 4 | 10 | 19 | 30 | 43 |
For cost, the equivalent measures are the earned value indexes in shutdown KPIs: SPI is earned value divided by planned value. 2
Calculator
How do you forecast the finish date from today's progress?
Divide actual progress by planned progress to get a progress ratio, then divide the planned duration by that ratio to project the duration if the current pace continues.
More tools are on the shutdown calculator tools page. See critical path vs critical chain for how float is worked out.
Try it: forecast the finish from today's progress
The report
What goes in a daily shutdown progress report?
A daily progress report shows planned versus actual progress, critical-path status, work done and not done, permits, safety, cost, scope changes, decisions needed and tomorrow's priorities, on one page.
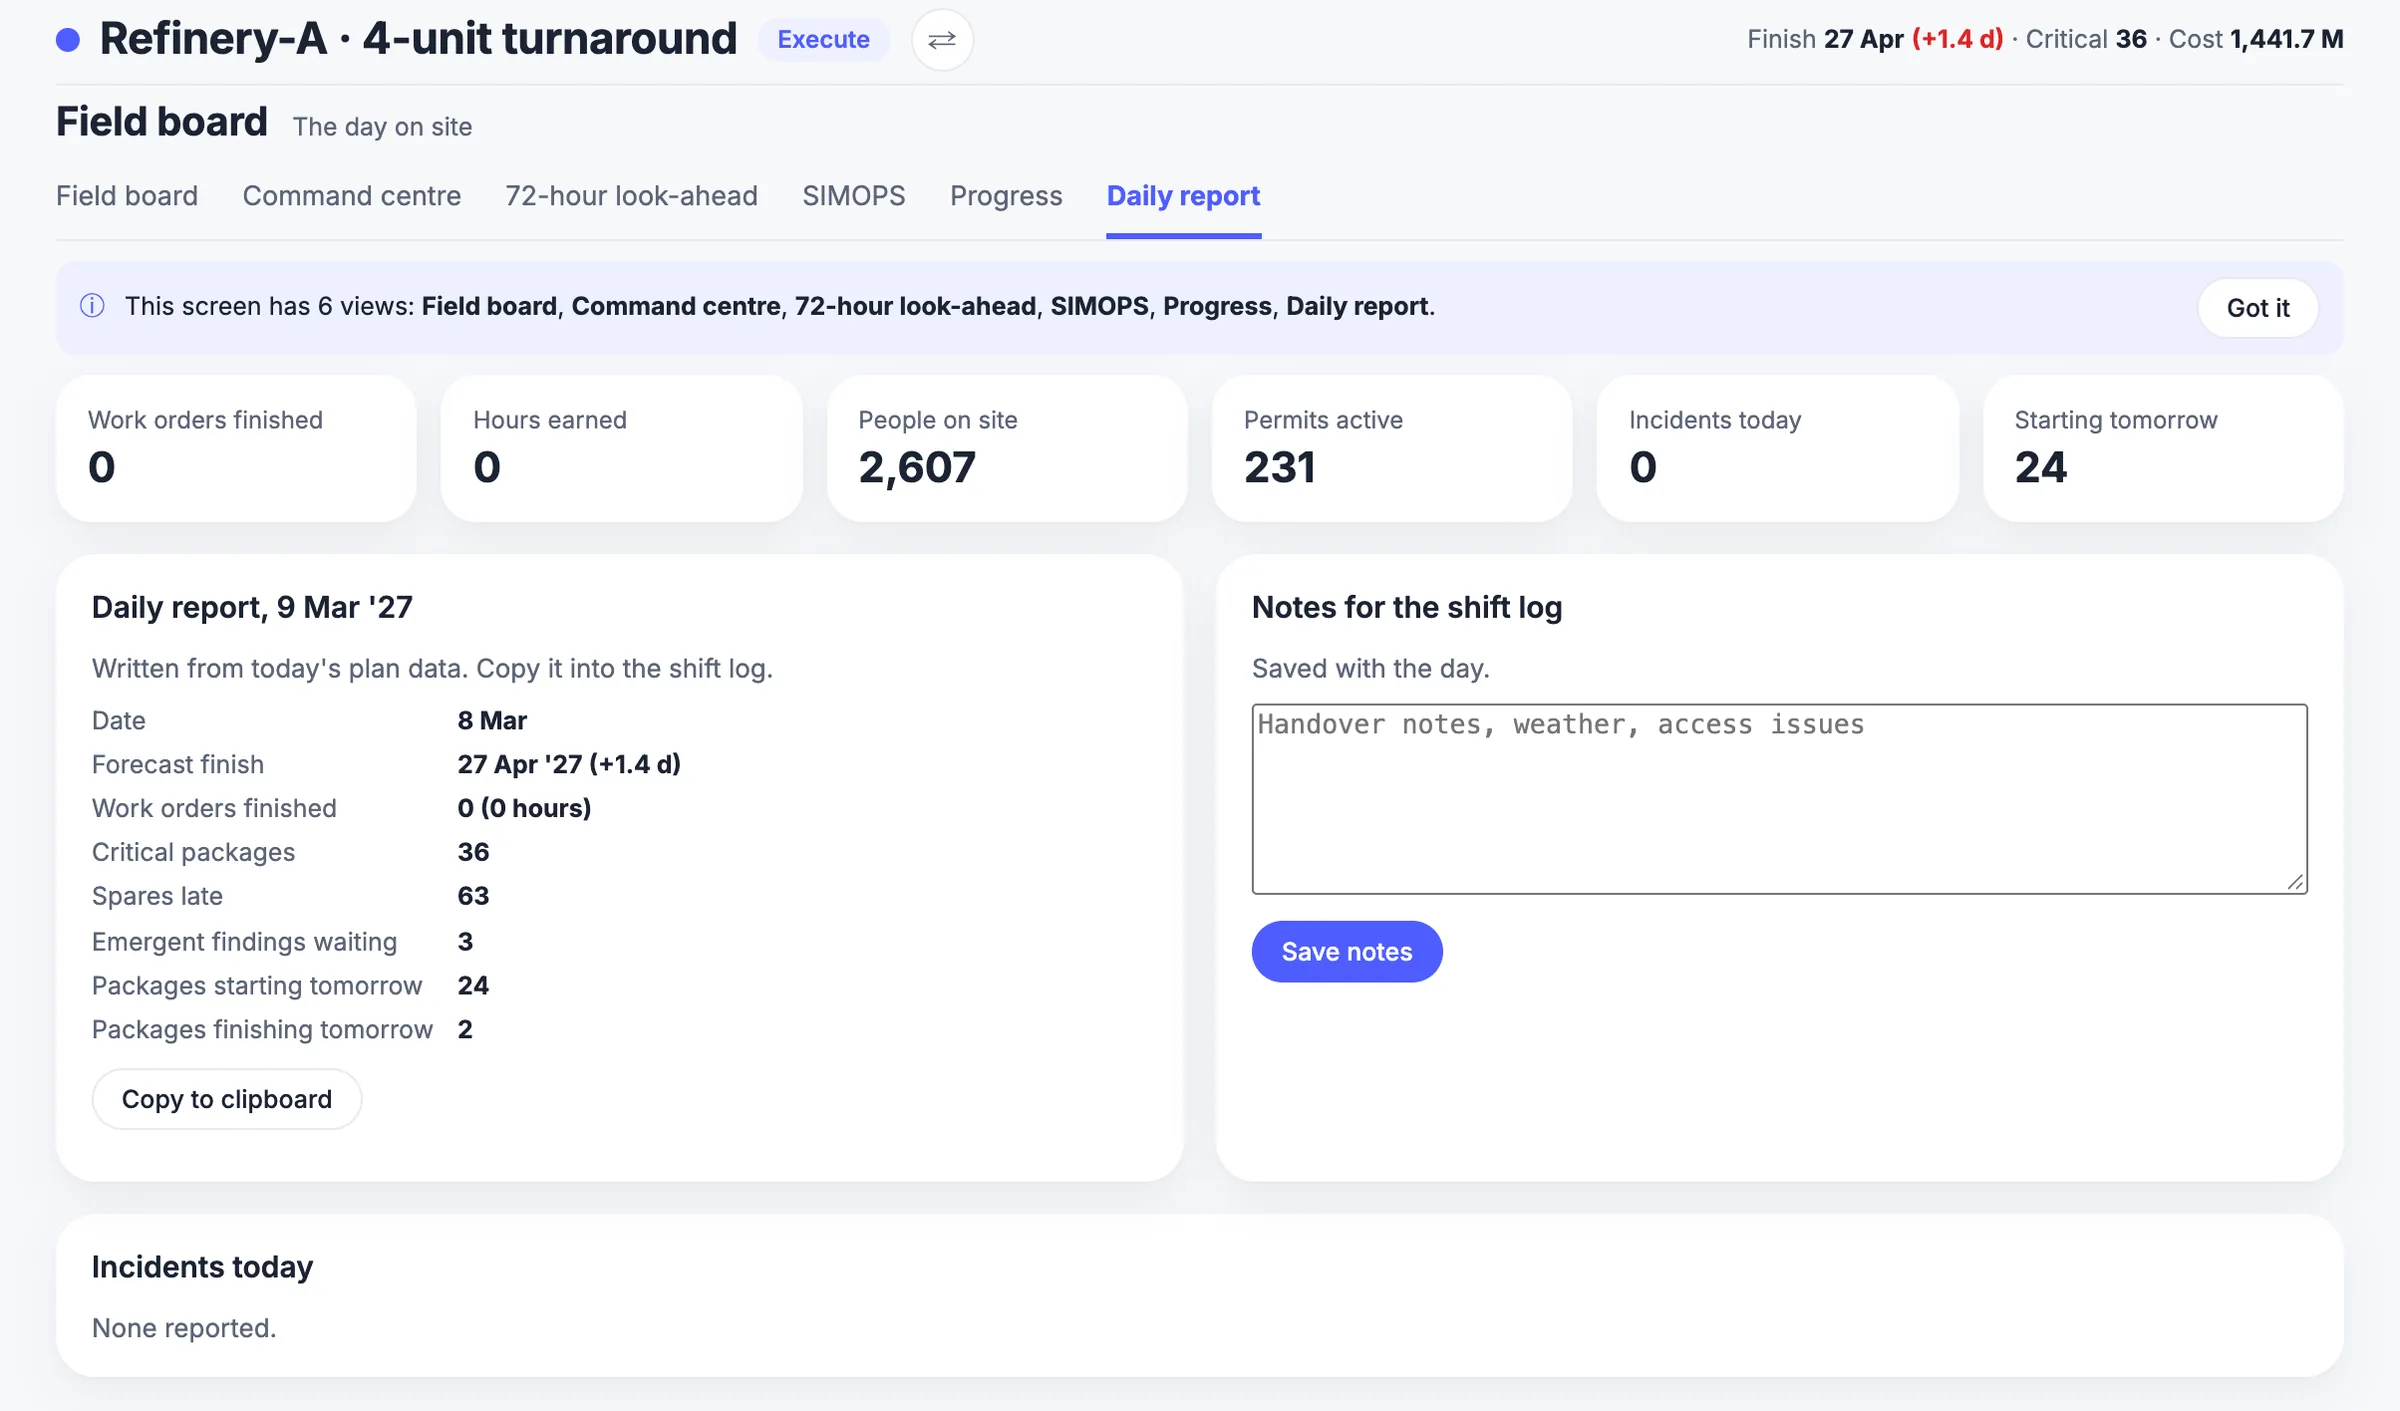
A daily progress and S-curve workbook is among the free shutdown templates. A free Excel file for this page: daily progress and S-curve workbook (.xlsx).
| Field | What it shows |
|---|---|
| Planned and actual progress | Cumulative percent, with the S-curve updated |
| Critical-path status | Jobs on or near the critical path, ahead or behind |
| Work completed and not completed | By area, with reasons for jobs not done |
| Permits and isolations | Issued, closed, waiting; isolations in force |
| Safety | Incidents, near misses, stop-work calls |
| Cost to date | Actual cost against the plan and contingency used |
| Scope changes | Requests approved, deferred or rejected today |
| Decisions needed | Issues for the shutdown manager, with an owner and a time |
| Tomorrow | Priorities, crews and materials to arrange |
The fields are a working template. Permit volumes and supervision are discussed in permit to work during shutdown; HSE guidance says very active periods such as shutdowns need extra resource for permit supervision or fewer active permits. 4
Visuals
Save the tracking charts
Two charts for the shutdown office wall. Click either for the full-size version.
FAQ
Frequently asked questions
How do you track progress during a shutdown?
Measure completed steps and actual dates against the baseline, report every job to one status date, and plot cumulative planned and actual progress on an S-curve. GAO explains why percent-complete estimates are subjective, especially for long activities. 1
What is an S-curve in shutdown management?
A chart of cumulative planned progress and cumulative actual progress against time. It is S-shaped because work ramps up, peaks and tails off; a gap between the lines shows how far behind or ahead the job is.
What should be in the daily progress report?
Planned and actual progress, critical-path status, work done and not done, permits, safety, cost, scope changes, decisions needed and tomorrow's priorities. The page lists the fields as a working template.
How long should the daily shutdown meeting be?
Short and fixed: the example agenda totals 25 minutes. HSE says shift handovers should be face to face, two-way and given enough time. 3
How do you forecast the finish date?
Divide actual progress by planned progress to get a ratio, then divide the planned duration by it. This simple projection assumes the current pace continues; it is not a standard method.
Why is percent complete unreliable?
GAO says percentage complete is subjective, more so as activity duration grows, since it depends on an expected duration that can vary. 1
How is schedule performance index calculated?
SPI is earned value divided by planned value. 2
Where does the progress data come from?
From the people doing the work, captured at the job, so planning, permits and cost read from the same records.
Sources
Sources
- US Government Accountability Office, GAO Schedule Assessment Guide: Best Practices for Project Schedules (GAO-16-89G, December 2015)
- US Government Accountability Office, GAO Cost Estimating and Assessment Guide (GAO-20-195G, March 2020)
- UK Health and Safety Executive, Human factors: Shift handover
- UK Health and Safety Executive, Guidance on permit-to-work systems: a guide for the petroleum, chemical and allied industries (HSG250, 2005)
Run the shutdown from one live plan
Book a demo and bring a typical shift. We will show tasks, readings, photos and findings in the module.