
Shutdown KPIs
Shutdown KPIs: Formulas, Worked Examples and a Calculator
Shutdown KPIs should cover cost and schedule with earned value measures (CV, CPI, SV, SPI, EAC), duration and scope growth against the baseline, and safety with both leading and lagging indicators. The formulas below come from the US GAO cost guide, BLS and NERC, with worked examples and a calculator.
There are no published benchmark values, so this page gives formulas and no target numbers.
How MaintWiz helps: You cannot improve what you measure after the shutdown ends. The MaintWiz shutdown module tracks earned value, cost and schedule indices and shows budget, actual and forecast cost in one view. See the module · Get the budget template
By Jai Balachandran · Published · Last reviewed
What MaintWiz adds:Earned value and cost indicesBudget, actual and forecast costCost by project and packageCumulative spend
The set
Which KPIs should a shutdown track?
A shutdown should track cost and schedule using earned value measures, duration and scope growth against the baseline, and safety using both leading and lagging indicators. The earned value formulas below are the standard definitions in the US Government Accountability Office cost guide. 1
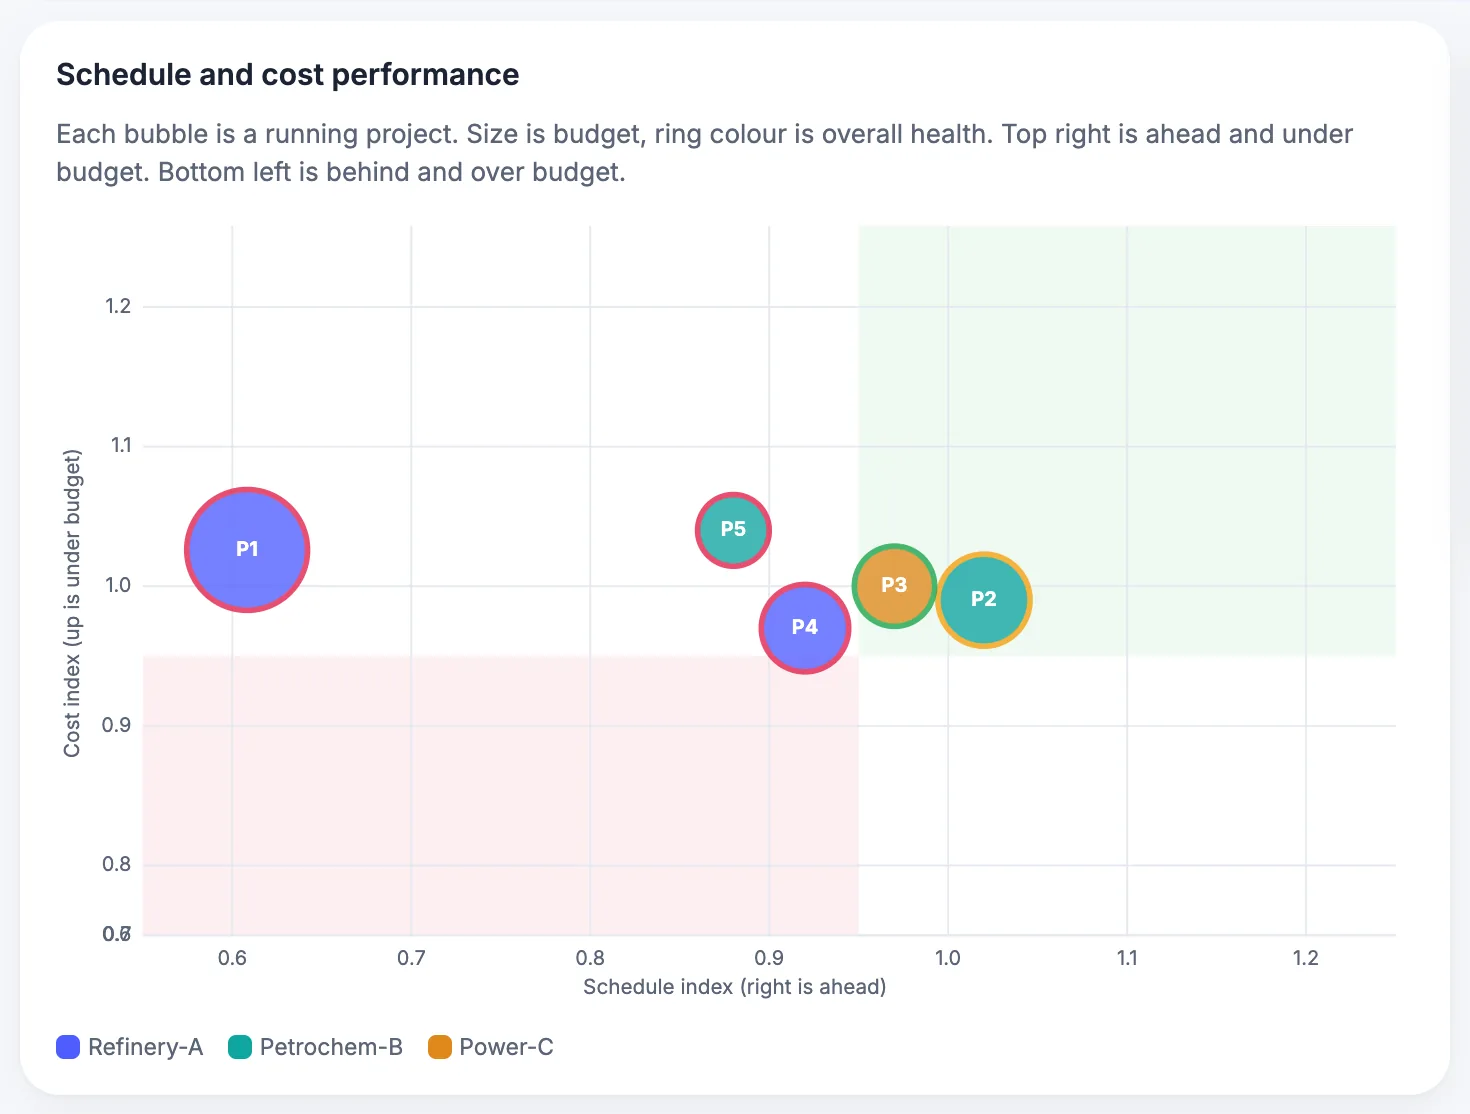
A KPI workbook that calculates these measures is in the shutdown planning templates. Earned value and index terms are defined in the shutdown turnaround glossary. Cost measures depend on a sound estimate: see how to estimate a shutdown budget.
BAC is the budget at completion, BCWS the planned value to date, BCWP the earned value and ACWP the actual cost. The cost and schedule numbers are the worked example from the budget guide: made-up units on day 5 of a 10-day job.
| KPI | Formula | Worked example | Basis |
|---|---|---|---|
| Cost variance (CV) | BCWP - ACWP | 392 - 441 = -49 (over budget) | GAO cost guide |
| Cost performance index (CPI) | BCWP / ACWP | 392 / 441 = 0.89 | GAO cost guide |
| Schedule variance (SV) | BCWP - BCWS | 392 - 435 = -43 (behind plan) | GAO cost guide |
| Schedule performance index (SPI) | BCWP / BCWS | 392 / 435 = 0.90 | GAO cost guide |
| Estimate at completion (EAC) | ACWP + (BAC - BCWP) / CPI | 441 + (870 - 392) / 0.89 = about 979 | GAO cost guide |
| Duration variance, % | (actual days - planned days) / planned days x 100 | (11 - 10) / 10 = 10% | Working definition |
| Scope growth, % | (final work scope - frozen scope) / frozen scope x 100 | (940 - 870) / 870 = 8.0% | Working definition |
| Recordable injury rate | cases x 200,000 / hours worked | 7 x 200,000 / 400,000 = 3.5 | BLS incidence rate |
| Planned outage factor (power plants) | planned outage hours / period hours x 100% | 480 / 8,760 = 5.5% | NERC GADS Appendix F |
| Permits issued with hazards and controls adequately specified, % | permits judged adequate / permits sampled x 100 | 47 / 50 = 94% | Indicator example in HSE HSG254 |
The two "working definition" rows have no published standard; use them only if your team agrees the same terms in advance. See the full worked example in shutdown budget planning.
Calculator
Can you check your own shutdown numbers?
Yes: enter your planned value, earned value, actual cost, durations, scope and injury data, and the calculator returns the eight KPIs defined in the table above.
The shutdown calculator tools page lists all the calculators with their inputs. To test a savings claim against your own baseline, see shutdown program ROI. The measures applied to an invented stop: shutdown case study planned vs actual. A free Excel file for this page: KPI workbook (.xlsx).
Try it: shutdown KPI calculator
Replace the starting numbers, which are the made-up worked example, with your own. Nothing is sent or stored; the sums run in your browser.
Software
Where should the KPI data come from?
KPI data should come from the same records that run the shutdown, so cost, progress and permits are measured once rather than re-typed into a report.
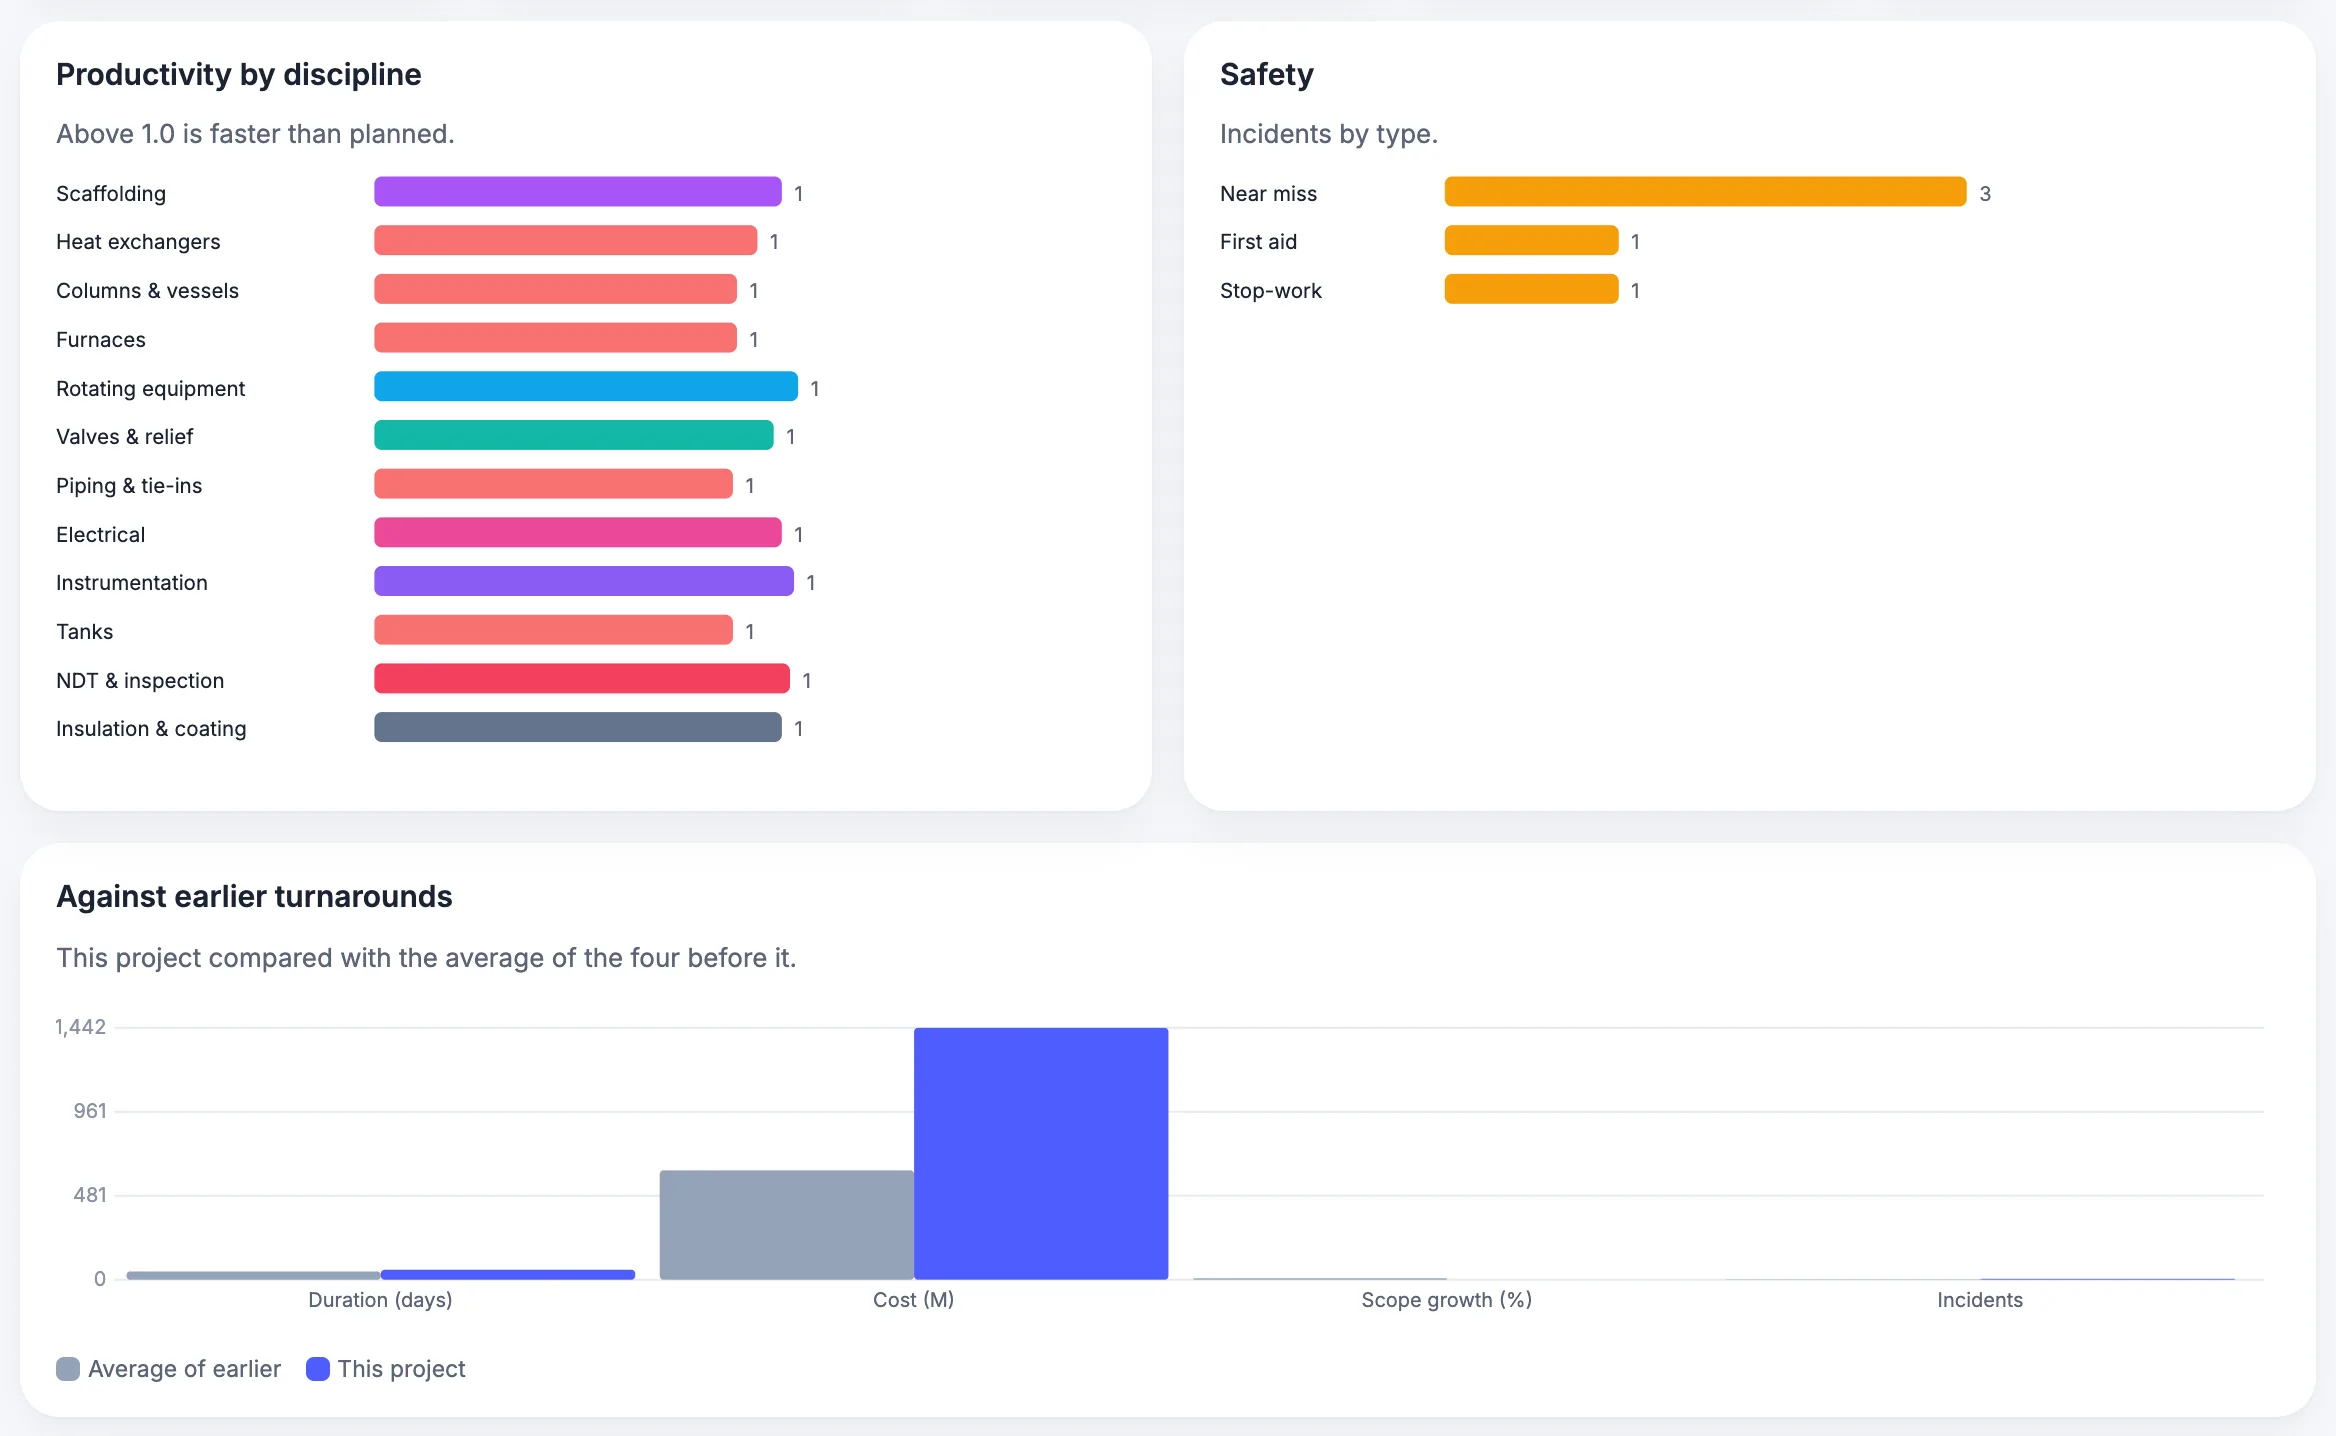
Common questions about the module are answered in the shutdown module FAQ. See digital shutdown management for what to digitize first.
About MaintWiz. MaintWiz is an industrial AI platform with IoT, SAP integration and predictive maintenance (PdM) capabilities. Its shutdown and turnaround module helps plants plan, schedule, execute and close out shutdown work.
Also: product data sheet.
What the shutdown module covers
As described on the MaintWiz shutdown maintenance product page.
- Shutdown calendar and critical-path scheduling, with work order sequencing and dependencies
- Asset prioritization, so the most critical equipment is scoped first
- Resource planning for people, spares, heavy equipment such as cranes, and outsourced vendors
- Electronic permits to work, risk management and contingency plans
- Real-time progress monitoring: schedule adherence, cost variance, quality metrics and risk factors
- Step-by-step checklists, pre-restart testing protocols and post-shutdown analysis
Proof
What MaintWiz customers report
Figures as published in MaintWiz case studies on maintwiz.com. They come from maintenance management projects, not shutdowns.
Reading them
How do you read the indexes and variances?
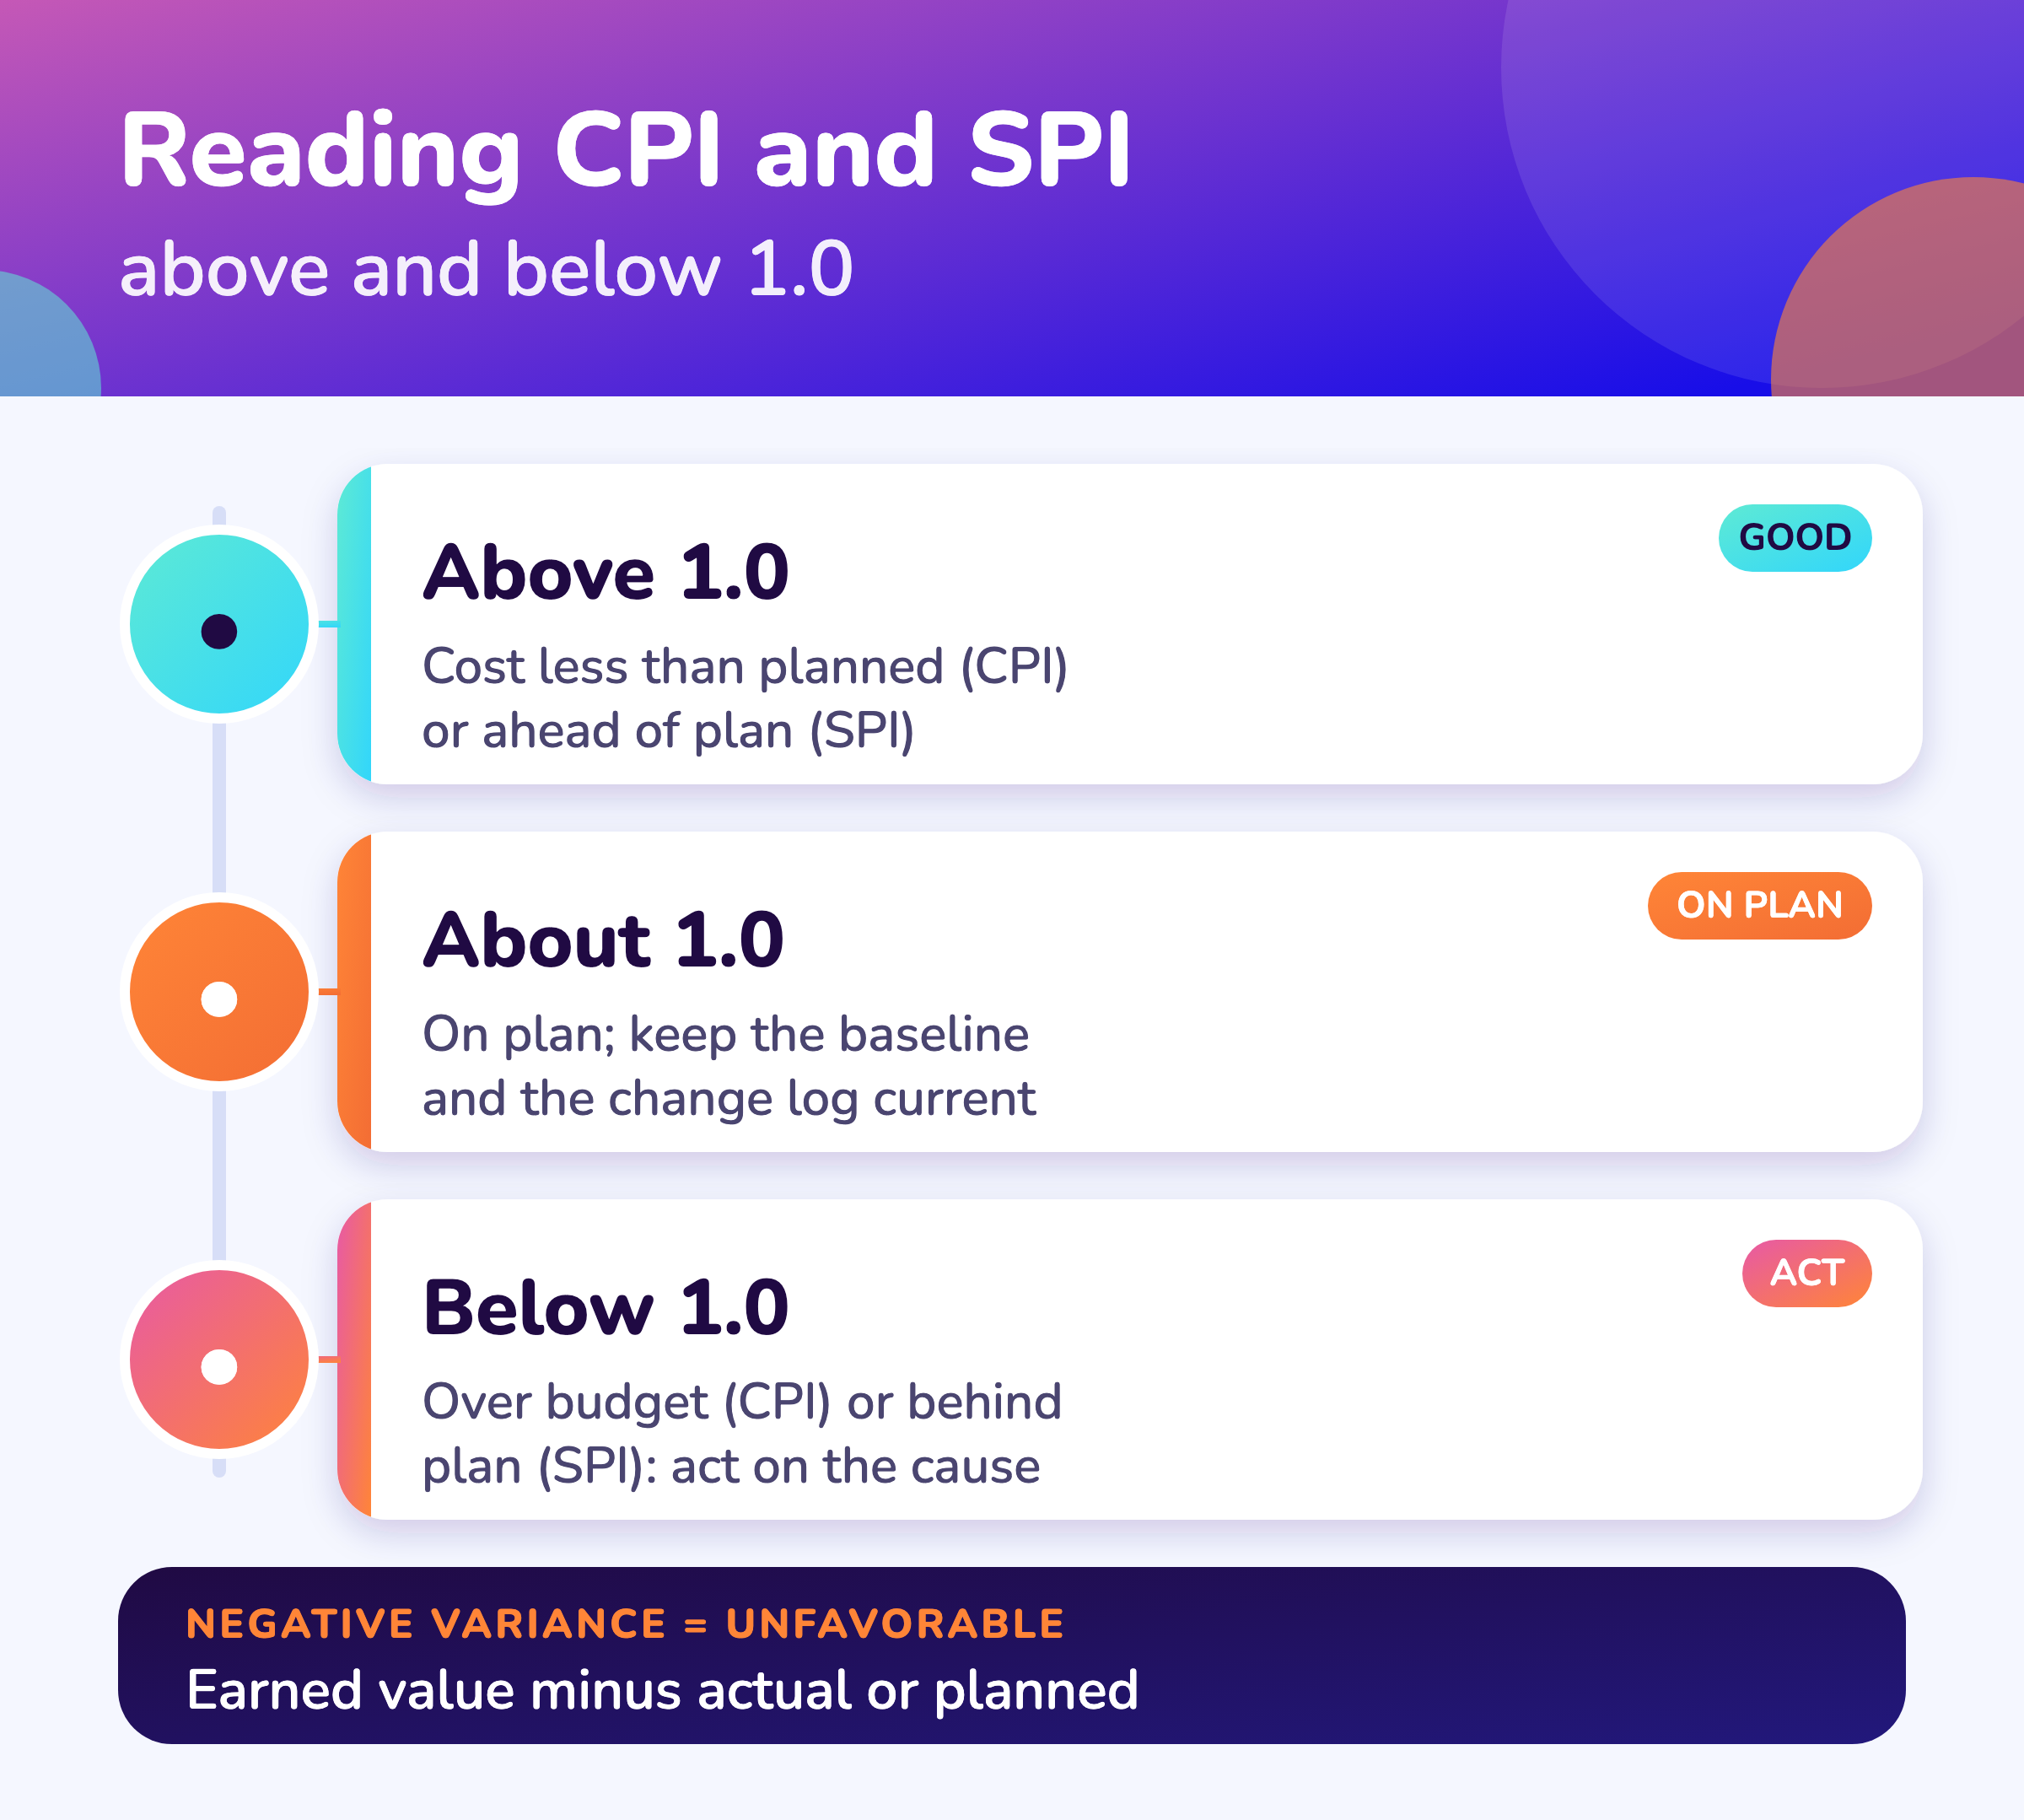
A CPI or SPI above 1.0 is favorable, below 1.0 is unfavorable, and a negative variance means over budget or behind plan. Earned value is only as reliable as the progress data behind it: GAO warns that percent-complete estimates are subjective, especially for long activities. 2
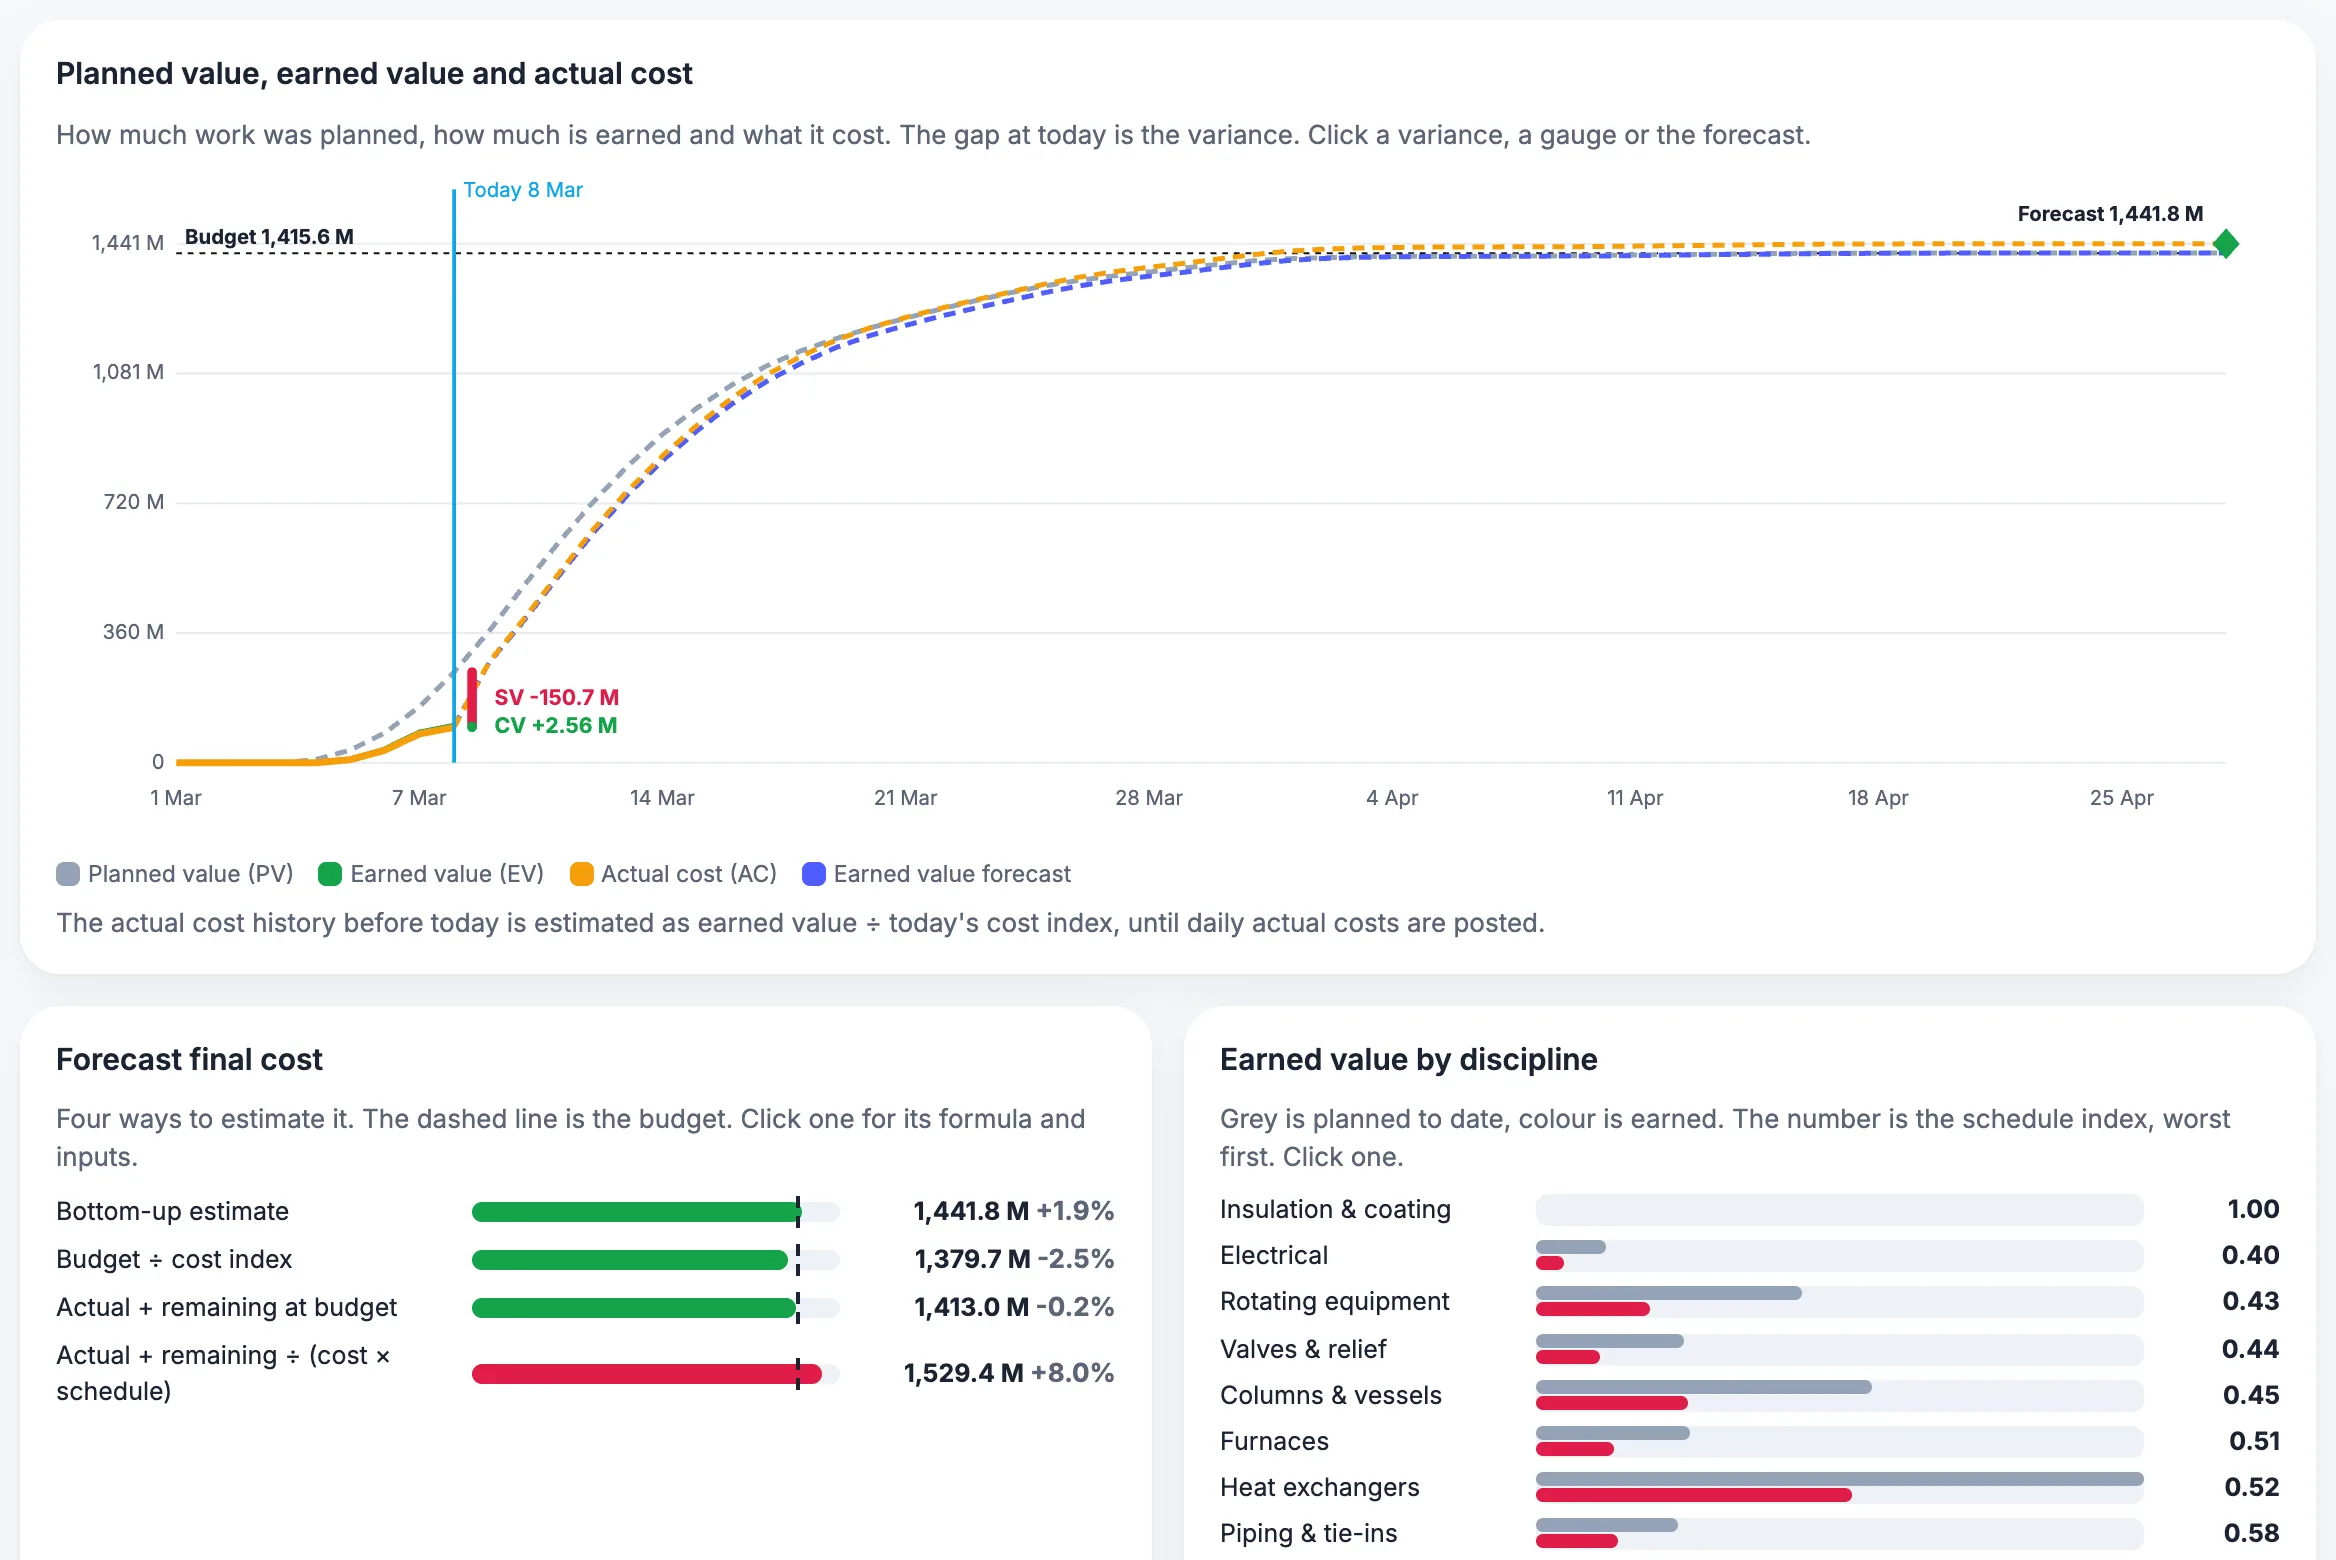
Float and critical path are worked by hand in critical path vs critical chain. For cost definitions, see planned vs unplanned shutdown cost. The schedule performance index is worked through in the shutdown S-curve and percent complete guide.
For example, GAO notes that 25 percent complete may be a viable estimate for a 4-day activity but is an ambiguous progress measure for a 50-day one. Break long jobs into short measurable steps. 2 GAO also cautions that earned value forecasts depend on reliable data and consistent baselines. 1
Index above 1.0
CPI or SPI > 1
The work cost less than planned (CPI) or progressed faster than planned (SPI).
Index below 1.0
CPI or SPI < 1
Over budget (CPI) or behind plan (SPI). At 0.89 CPI, each unit of earned value cost about 1.12 units.
Variance sign
negative = unfavorable
Cost and schedule variance are earned value minus actual or planned, so a negative number is bad news.
Benchmarks
Are there public benchmarks for shutdown KPIs?
There is no published benchmark for shutdown cost, schedule or safety performance, so this page gives formulas and no target values.
On what is and is not public for refinery turnarounds, see T&I turnaround and inspection planning. For one published benchmark source, EIA, see nuclear refueling outage durations and for what is not public see shutdown program ROI. For the cost measures that drive overrun, see why shutdowns go over budget. Your own history is the benchmark: S/4HANA migration and maintenance history.
The previous version of this page showed industry ranges with no source; they were removed. Comparing against peers needs matching definitions of what counts as scope, when the baseline was set and which hours are included, and published comparative data rarely says. The reliable comparison is your own previous shutdowns, measured the same way.
If you can share anonymized figures from your own shutdowns and the method behind them, those can be published here as a labeled sample with the period, sector and sample size.
Safety
Why not rely on injury rate alone?
Injury rate counts harm that has already happened and says little about whether process safety controls are working. The CSB found that reliance on BP Texas City's low personal injury rate gave a misleading picture of process safety. 6
For T&I examples see T&I turnaround and inspection planning.
HSE's process safety indicator guide pairs a leading indicator with a lagging indicator for each critical control, so the first shows gaps found in routine checks and the second shows failures that have occurred. 5 See shutdown safety plan for example indicators.
Cadence
How often should shutdown KPIs be reported?
Report a few operating measures every shift, the earned value indexes daily, cost forecasts weekly on long events, and the full set at close-out. The table is a working template, not a standard.
Who reviews the KPIs is set out in shutdown team roles and RACI.
| When | KPIs | Purpose |
|---|---|---|
| Every shift | Permits live and adequately specified; planned vs actual progress on critical-path jobs | Steer the day |
| Daily | SPI, CPI, forecast duration, scope changes approved | Decide at the daily meeting |
| Weekly (multi-week events) | EAC against budget plus contingency, scope growth, recordable cases | Report to management |
| At close-out | Final duration variance, scope growth, cost variance, injury rate, lessons | Feed the next shutdown |
Daily mechanics are in shutdown progress tracking; the close-out review is in shutdown lessons learned.
Visuals
Save the KPI cards
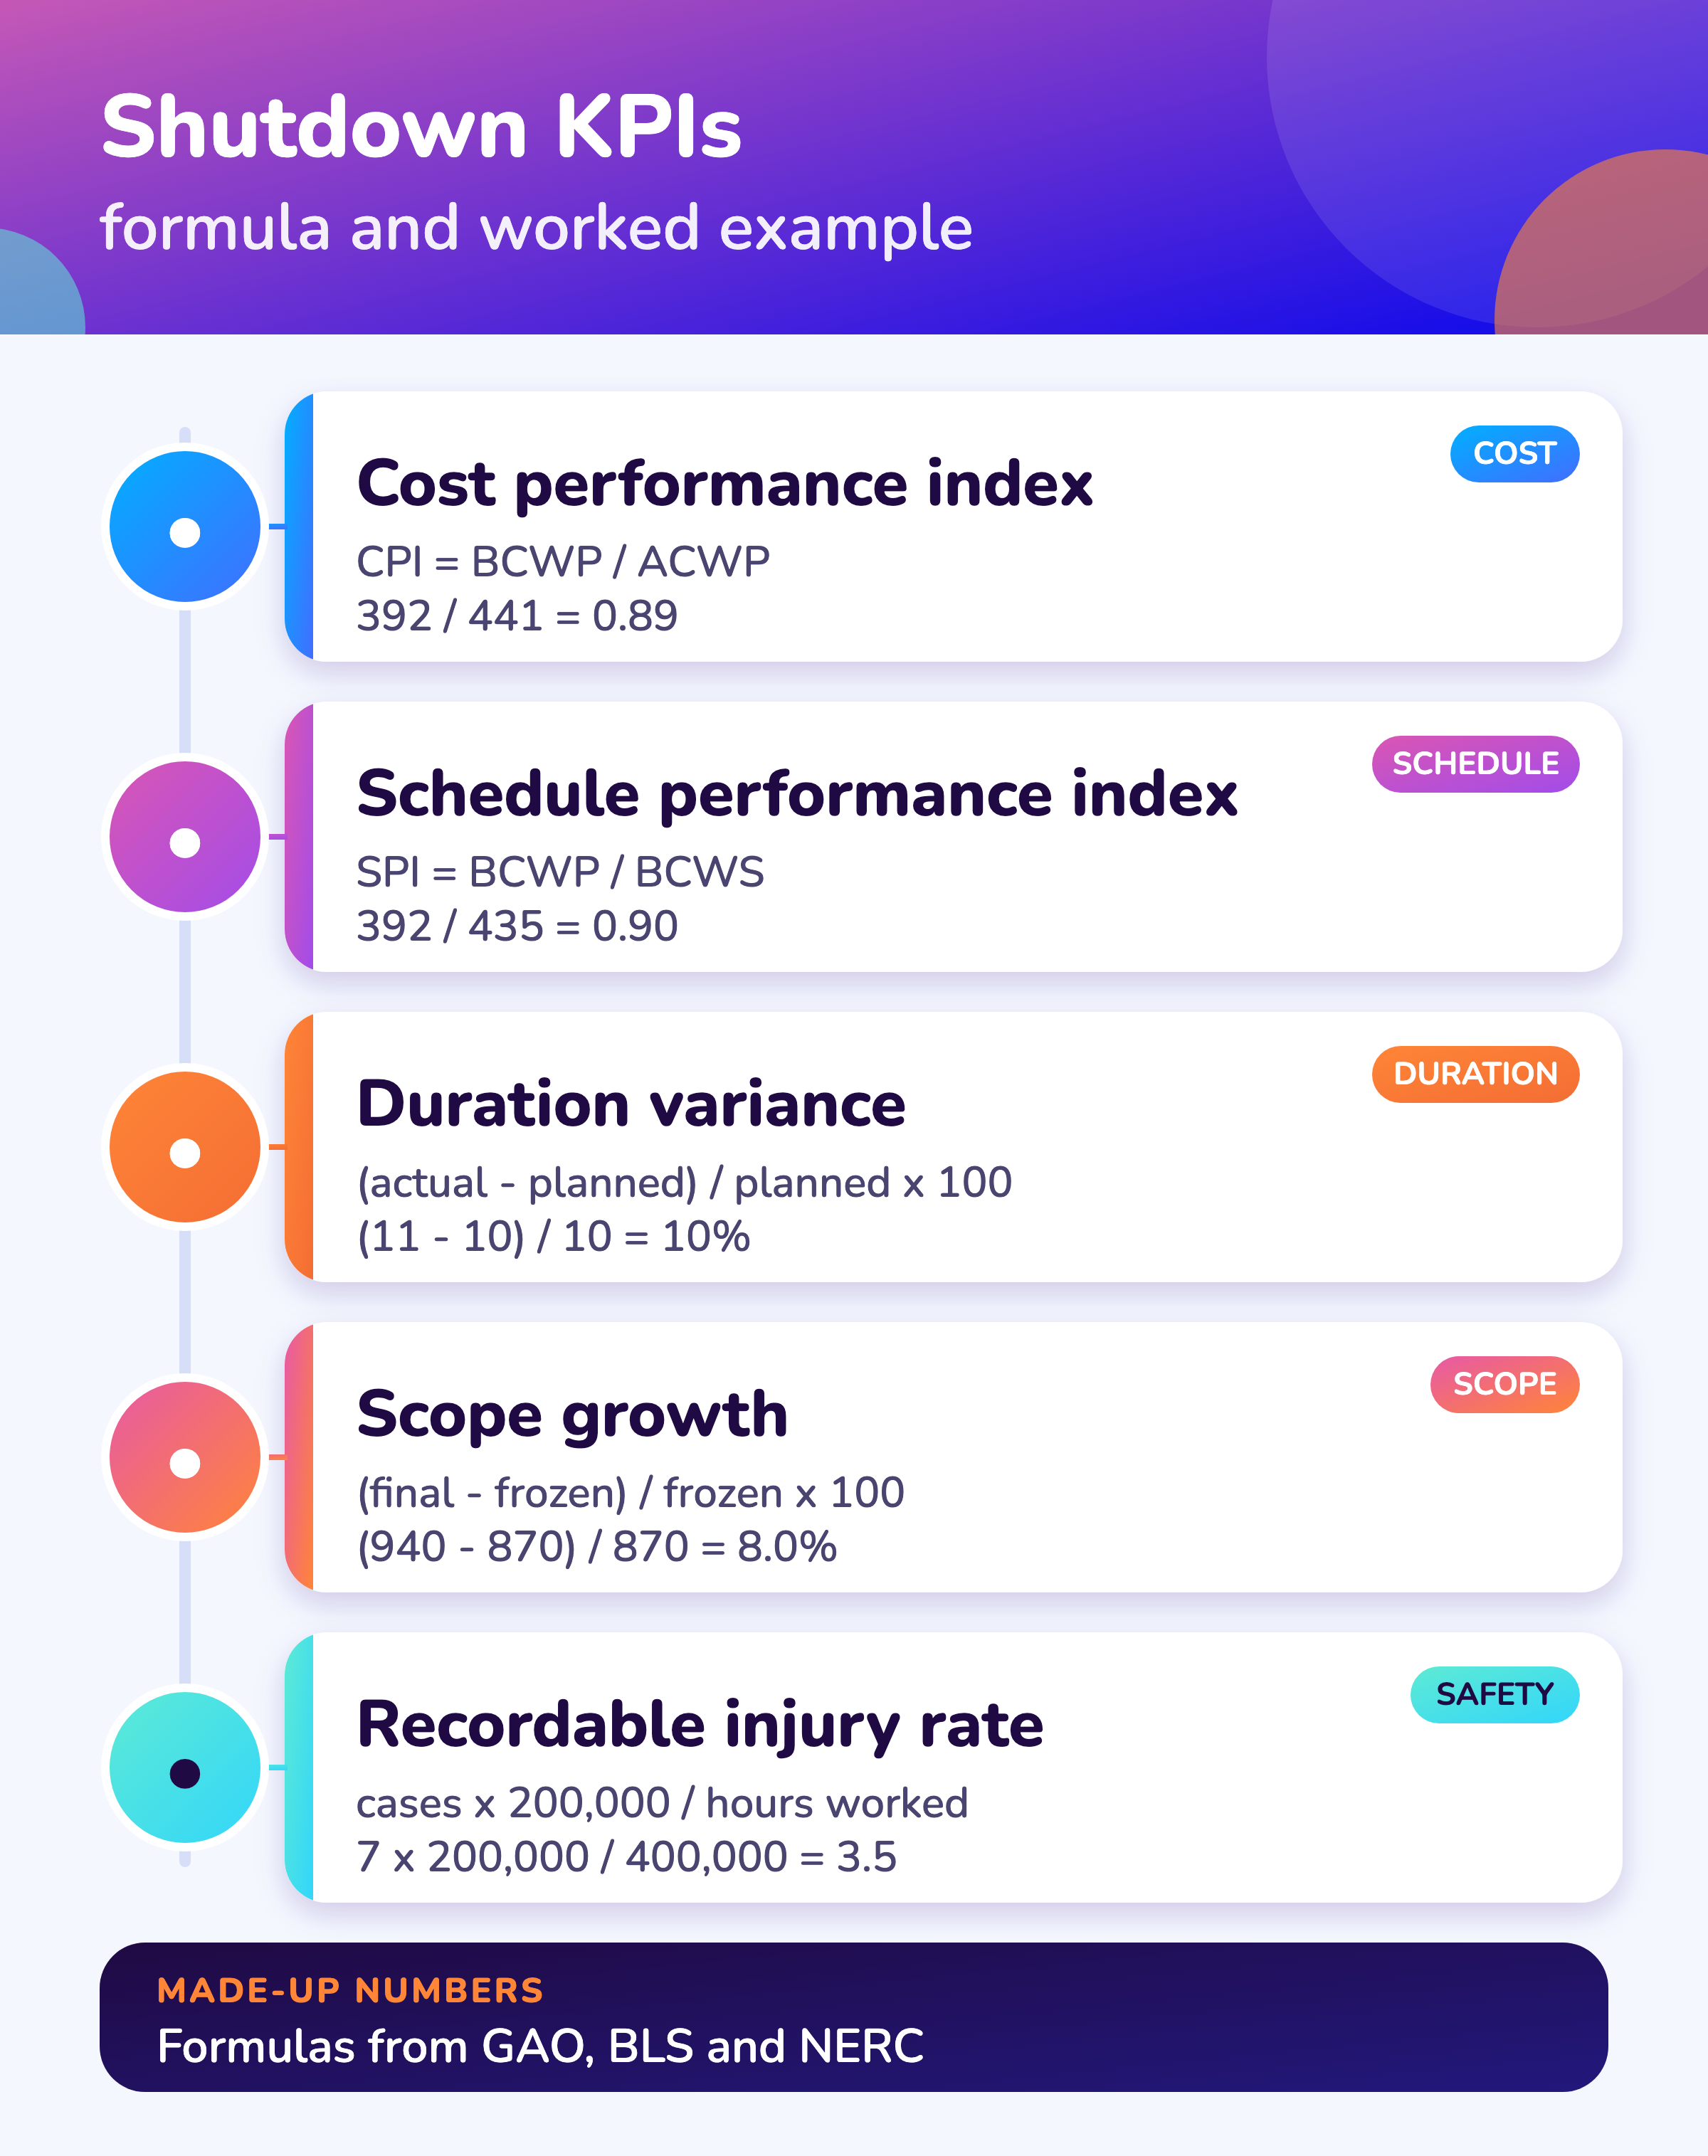
Two cards to pin up in the shutdown office. Click either for the full-size version.
FAQ
Frequently asked questions
What KPIs should I use to measure a shutdown?
Cost variance and cost performance index, schedule variance and schedule performance index, estimate at completion, duration variance against the baseline, scope growth, recordable injury rate and leading safety indicators. The earned value formulas are defined in the GAO cost guide. 1
How do you calculate cost performance index?
CPI = earned value divided by actual cost (BCWP / ACWP). With 392 earned and 441 spent, CPI is 0.89. 1
How do you calculate schedule performance index?
SPI = earned value divided by planned value (BCWP / BCWS). With 392 earned and 435 planned, SPI is 0.90. 1
What is estimate at completion?
A forecast of final cost: actual cost to date plus the remaining budget divided by an efficiency index such as CPI. In the example, 441 + (870 - 392) / 0.89 is about 979. 1
How do you calculate the injury rate?
Recordable cases multiplied by 200,000 and divided by hours worked by all employees. Seven cases over 400,000 hours is 3.5. 3
What is planned outage factor?
In NERC GADS reporting for generating units, planned outage hours divided by period hours, times 100%. 480 planned outage hours in an 8,760-hour year is 5.5%. 4
Are there industry benchmarks for shutdown performance?
There is no published benchmark. Compare your own shutdowns, measured with the same definitions.
Sources
Sources
Formulas come from the GAO cost guide, BLS and NERC as cited. Worked examples use made-up numbers and are labeled that way; the duration and scope rows are working definitions. Check each source before relying on a definition.
- US Government Accountability Office, GAO Cost Estimating and Assessment Guide (GAO-20-195G, March 2020)
- US Government Accountability Office, GAO Schedule Assessment Guide: Best Practices for Project Schedules (GAO-16-89G, December 2015)
- US Bureau of Labor Statistics, How to compute your firm's incidence rate for safety management
- North American Electric Reliability Corporation, GADS Data Reporting Instructions, Appendix F: Equations (2025)
- UK Health and Safety Executive, Developing process safety indicators: a step-by-step guide for chemical and major hazard industries (HSG254, 2006)
- US Chemical Safety and Hazard Investigation Board, Investigation Report: Refinery Explosion and Fire, BP Texas City (Report No. 2005-04-I-TX)
See cost and schedule performance in one view
Book a demo and bring your shutdown budget. We will show earned value and forecast cost in the module.